- XRP and XLM prices showed resilience amid intense market volatility on Tuesday, holding the $2.50 and $0.30 levels respectively.
- Stellar’s Q4 Report: XLM chain hosts $458M in tokenized assets as the team pushes for dominance in Real World Assets (RWA).
- XLM’s Upside Potential: Strong correlation with XRP and technical indicators suggest XLM could surge if $0.30 support remains solid.
Ripple (XRP) and Stellar (XLM) prices show resilience amid intense market volatility on Tuesday. The Q4 2024 report issued by the Stellar team reveals critical data points that could spark considerable long-term XLM gains.
Stellar Foundation Q4 2024 Performance Posts Optimistic Outlook
Ripple (XRP) and Stellar (XLM) held firm amid Tuesday’s intense volatility, fueled by fiscal and macroeconomic risks posed by the Trump adminstration receent tariffs policies.
Notably, XLM and XRP have exhibited strong price correlation since inception, largely due to their shared origins—as Stellar’s founder, Jed McCaleb, also co-founded XRP.
While the broader crypto market experienced sharp swings over renewed trade war concerns, Stellar’s Q4 2024 report, unveiled at its media event on February 4, highlighted key fundamentals that could drive long-term growth.
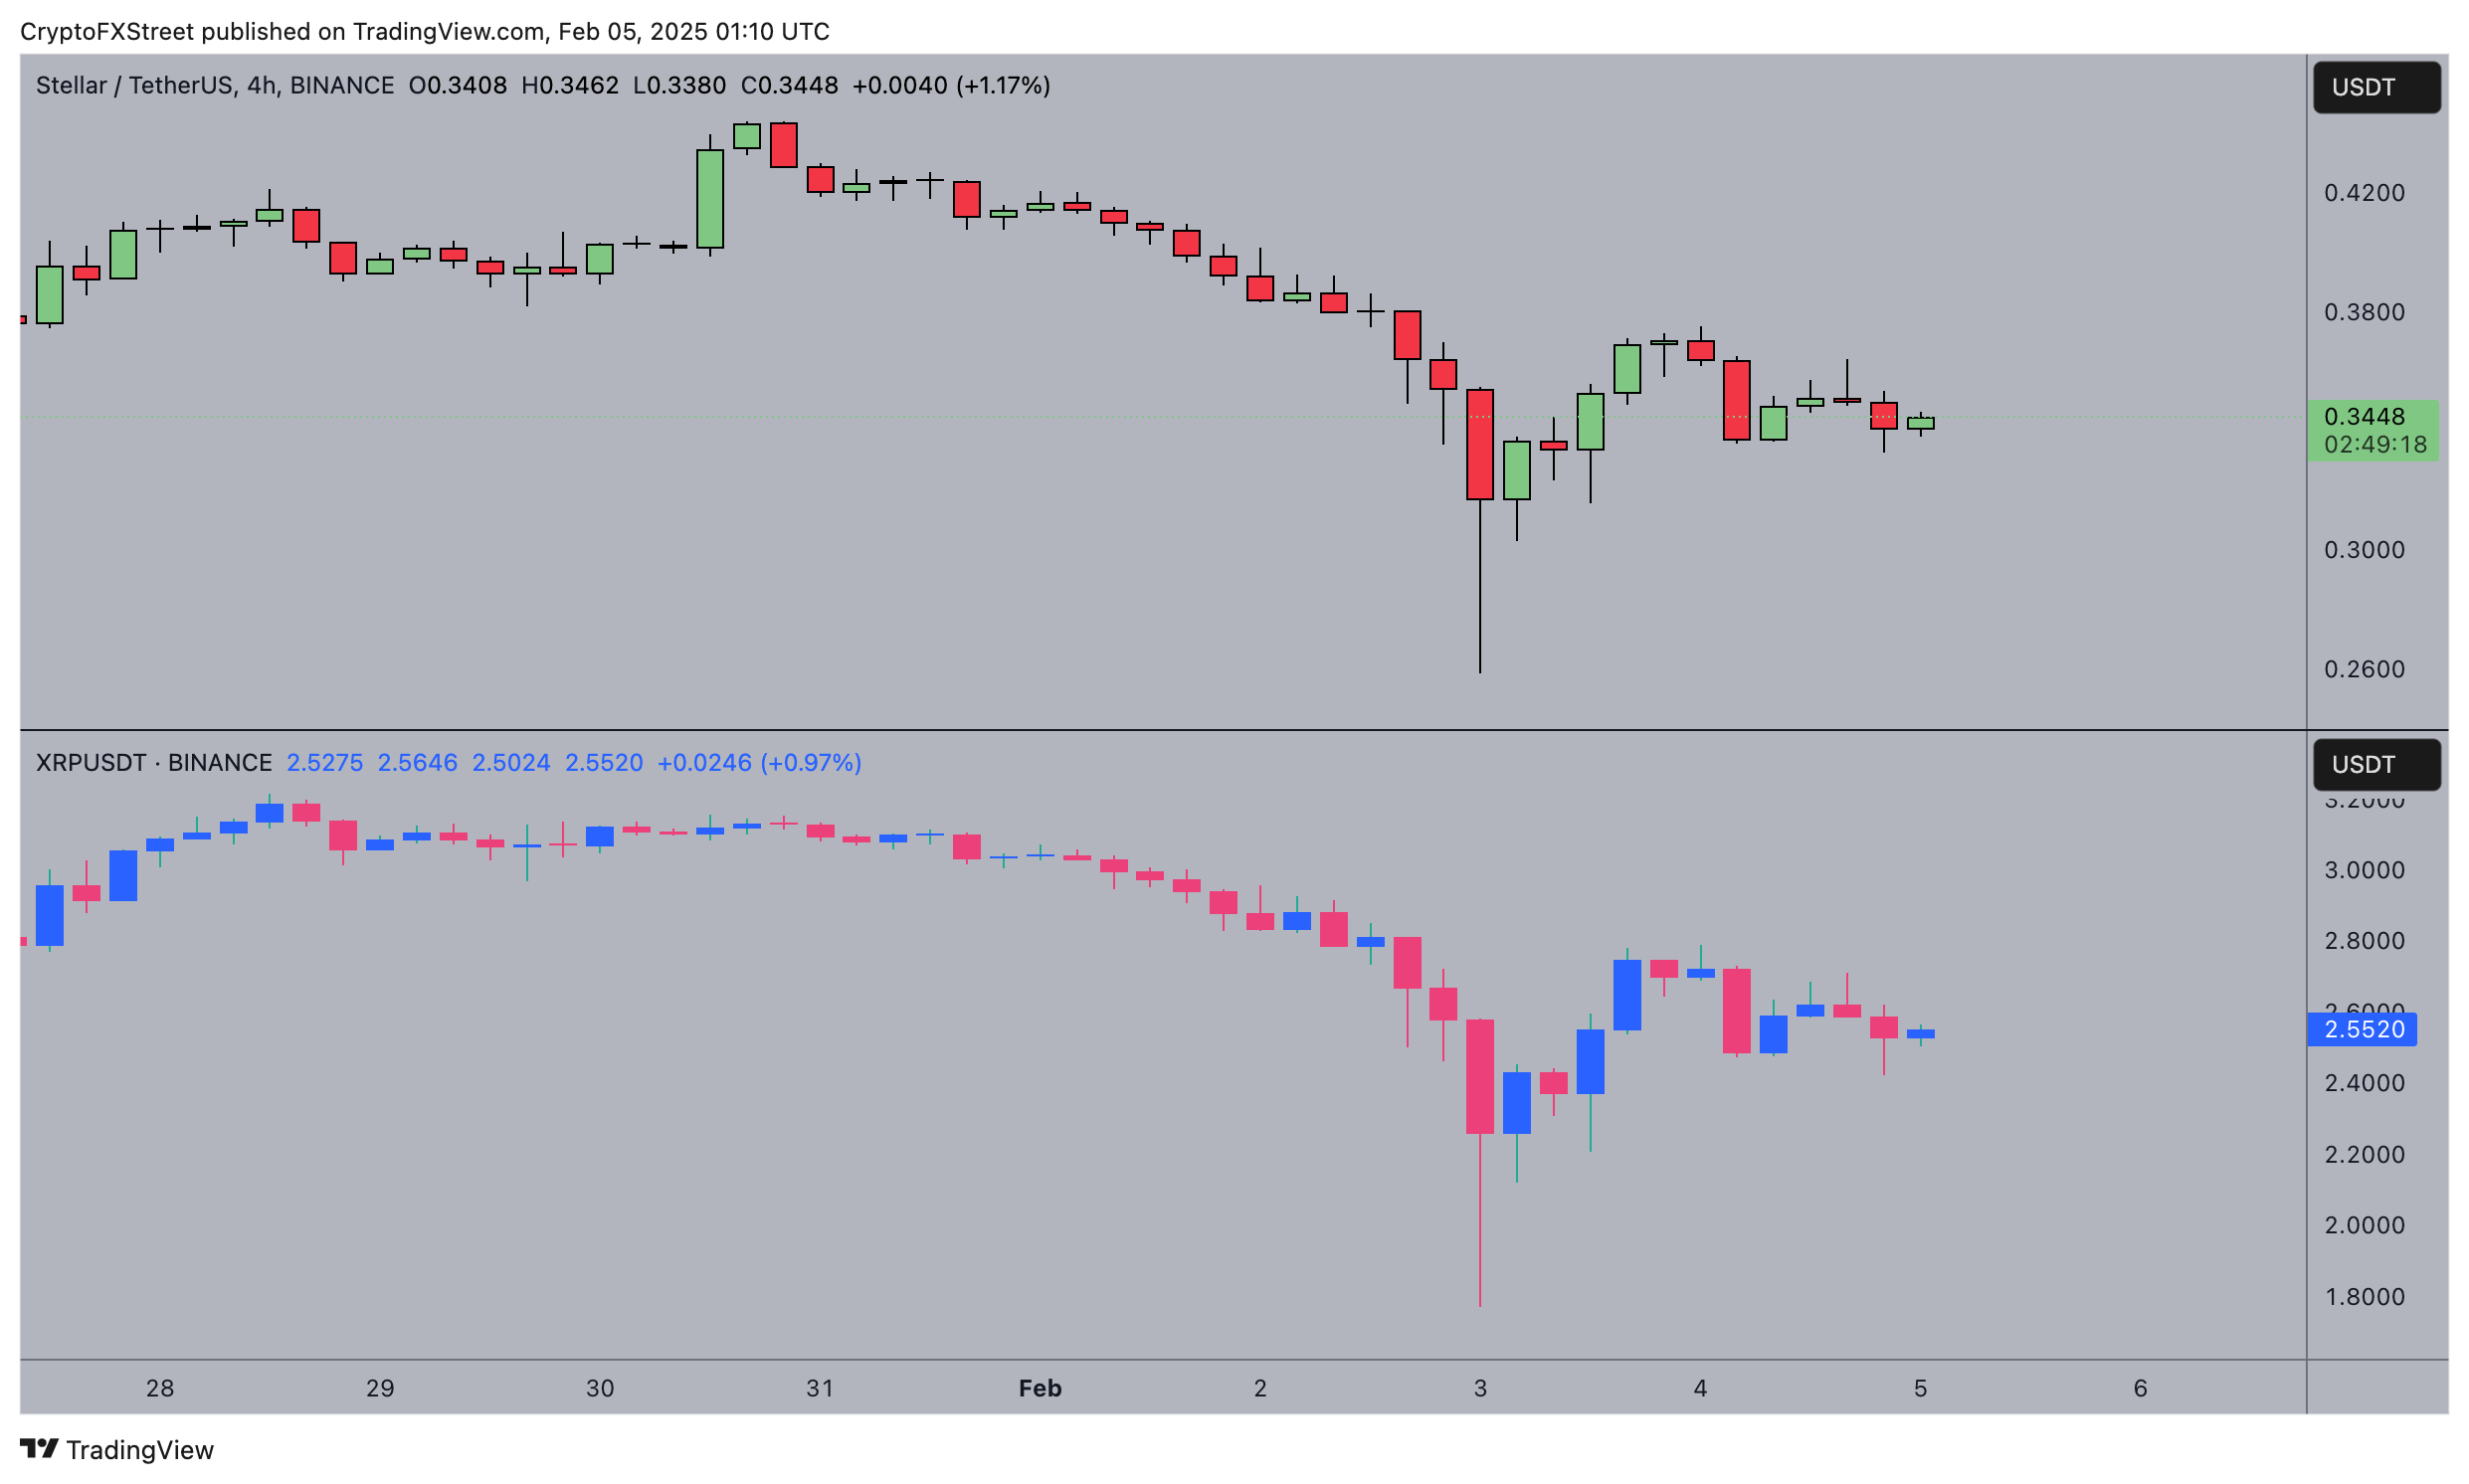
Stellar (XLM) vs Ripple (XRP) 4-hourly chart, Feb 5, 2025 | Source: TradingView
During the Stellar Development Foundation’s Quarter in Review: Q4 2024 event, the team highlighted rapid growth in key network metrics.
The report revealed that Stellar now boasts 9 million total addresses, reinforcing its expanding adoption.
The network also processed a staggering $4.1 billion in RWA payments volume in Q4 alone, underscoring its increasing relevance in tokenized real-world assets.
However, due to the intense market focus on US trade policies, the report initially flew under the radar.
On Tuesday, President Trump’s decision to pause tariffs on Mexico and Canada briefly fueled a 10% rally in XRP and XLM during US morning trading.
However, Beijing’s swift response—announcing retaliatory tariffs against key US imports—led to renewed market uncertainty, causing a sharp downturn in commodities and risk assets.
Despite this macro-driven volatility, key data points in Stellar’s Q4 report highlight a long-term bullish outlook for XLM price.
-
1. Stellar ranks 3rd in Total transactions processed
Stellar emerged as the third-largest blockchain by total transactions processed in Q4, showcasing its growing network activity.
Transaction volume is a critical indicator of network health, as higher usage often translates into increased demand for the native asset, XLM.
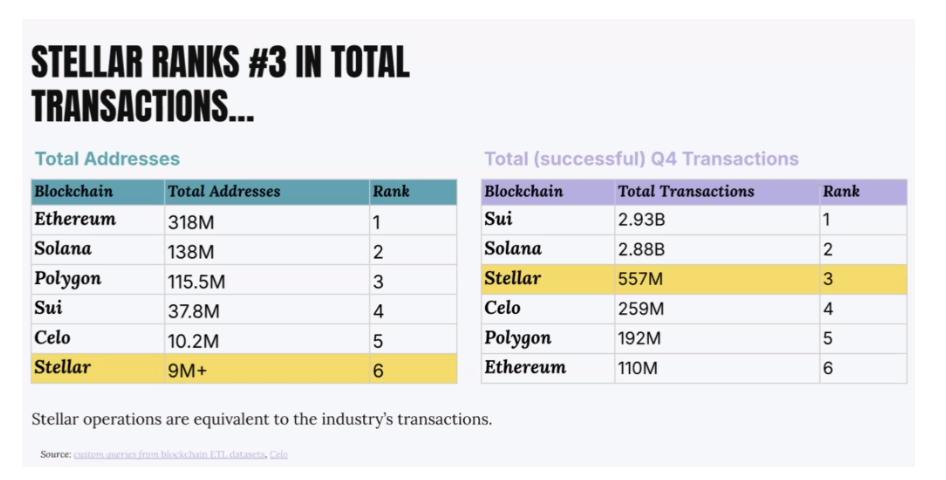
XLM Total Transactions | Source: Stellar Q4 Report
A comparative analysis of Stellar’s Q4 transaction count against rival Layer-1 blockchains highlights its competitive position.
While Ethereum (ETH) continues to dominate with smart contract executions, with 318 million addresse, Stellar’s high transaction throughput, 508 total active nodes, and an average ledger close time of 5.93 seconds give it a significant efficiency advantage.
This has helped Stellar attract 9 million active addresses, placing it 5th among the select blockchain networks/
From a price-action perspective, Stellar’s consistent growth in transaction volume sets a strong foundation for future price appreciation.
If the trend continues, XLM could see increasing institutional and retail adoption, pushing prices higher.
-
2. Stellar enters top 4 in RWA market dominance with $458M in tokenized assets
The Q4 report also confirmed that Stellar currently ranks #4 in total RWA market capitalization, with $458 million worth of tokenized assets on its blockchain.
The rapid expansion of the RWA sector has been a key driver for institutional crypto adoption, as projects seek to tokenize traditional assets such as bonds, equities, and real estate.
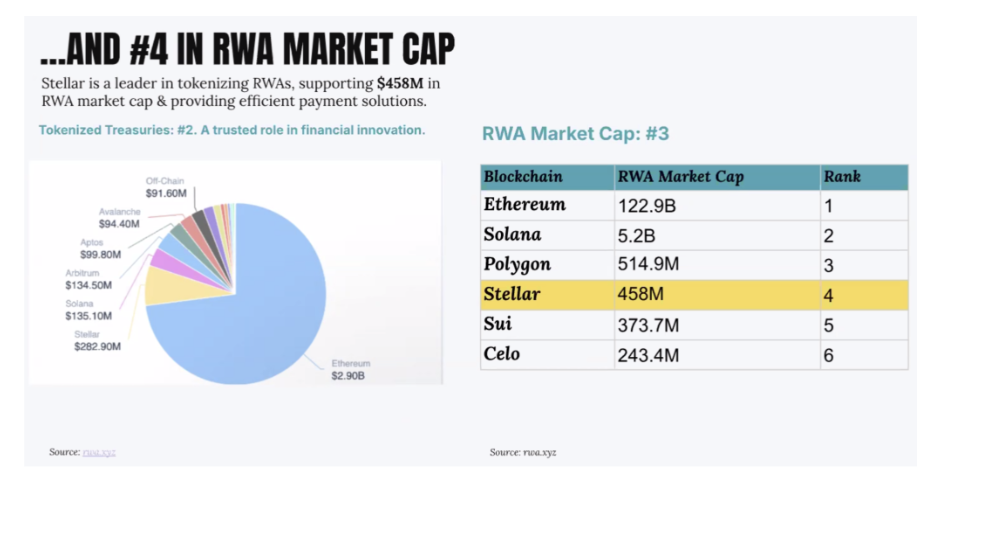
XLM Real Word Asset (RWA) market share | Source: Stellar Q4 Report
With AI and RWA expected to be dominant crypto narratives in 2025, Stellar’s positioning within this space could yield substantial upside for XLM.
Analysts suggest that increased market share in RWA tokenization could drive a significant re-rating of XLM’s value.
If Stellar moves up the rankings and surpasses its competitors, the influx of institutional capital could push XLM prices upwards.
-
3. Stellar ranks #1 in Transaction fees efficiency
Another standout metric from the Q4 report is Stellar’s #1 ranking in average transaction fees globally.
Low transaction fees remain a critical factor in blockchain scalability and adoption, particularly for enterprises and payment providers looking for cost-effective solutions.
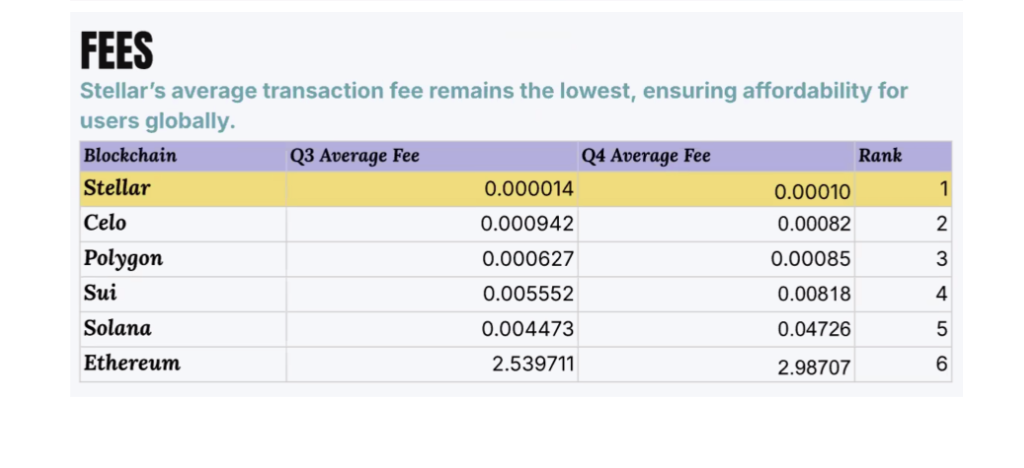 XLM Transactions Fees | Source: Stellar Q4 Report
The chart above shows that Stellar transactions cost reduced from $0.0000014 in Q3 to reach $0.000010 in Q4 despite peak market activity around Trump's re-election.
Compared to Ethereum’s rising gas fees, Stellar’s fee structure offers a major advantage for businesses and users conducting frequent on-chain transactions.
The network’s low-fee environment, coupled with its high throughput and increasing RWA integration, strengthens the case for long-term adoption.
As institutional investors and enterprises continue seeking cost-efficient blockchain solutions, Stellar’s transaction fees efficiency could drive further demand for XLM.
Stellar Price Forecast: Falling Wedge Pattern hints 120% breakout
If Stellar maintains its competitive edge as depicted in the Q4 report and market sentiment stabilizes, XLM and XRP prices appear positioned for major upside in the mid-to-long term.
Validating this outlook, the falling wedge pattern on the XLM price forecast chart signals a potential 120% breakout, targeting the $0.75–$0.80 range in the mid-term.
This bullish reversal pattern typically forms after a prolonged downtrend, indicating waning selling pressure and an impending breakout.
The breakout confirmation will require a decisive move above the upper trendline resistance near $0.40, aligning with prior liquidity zones.
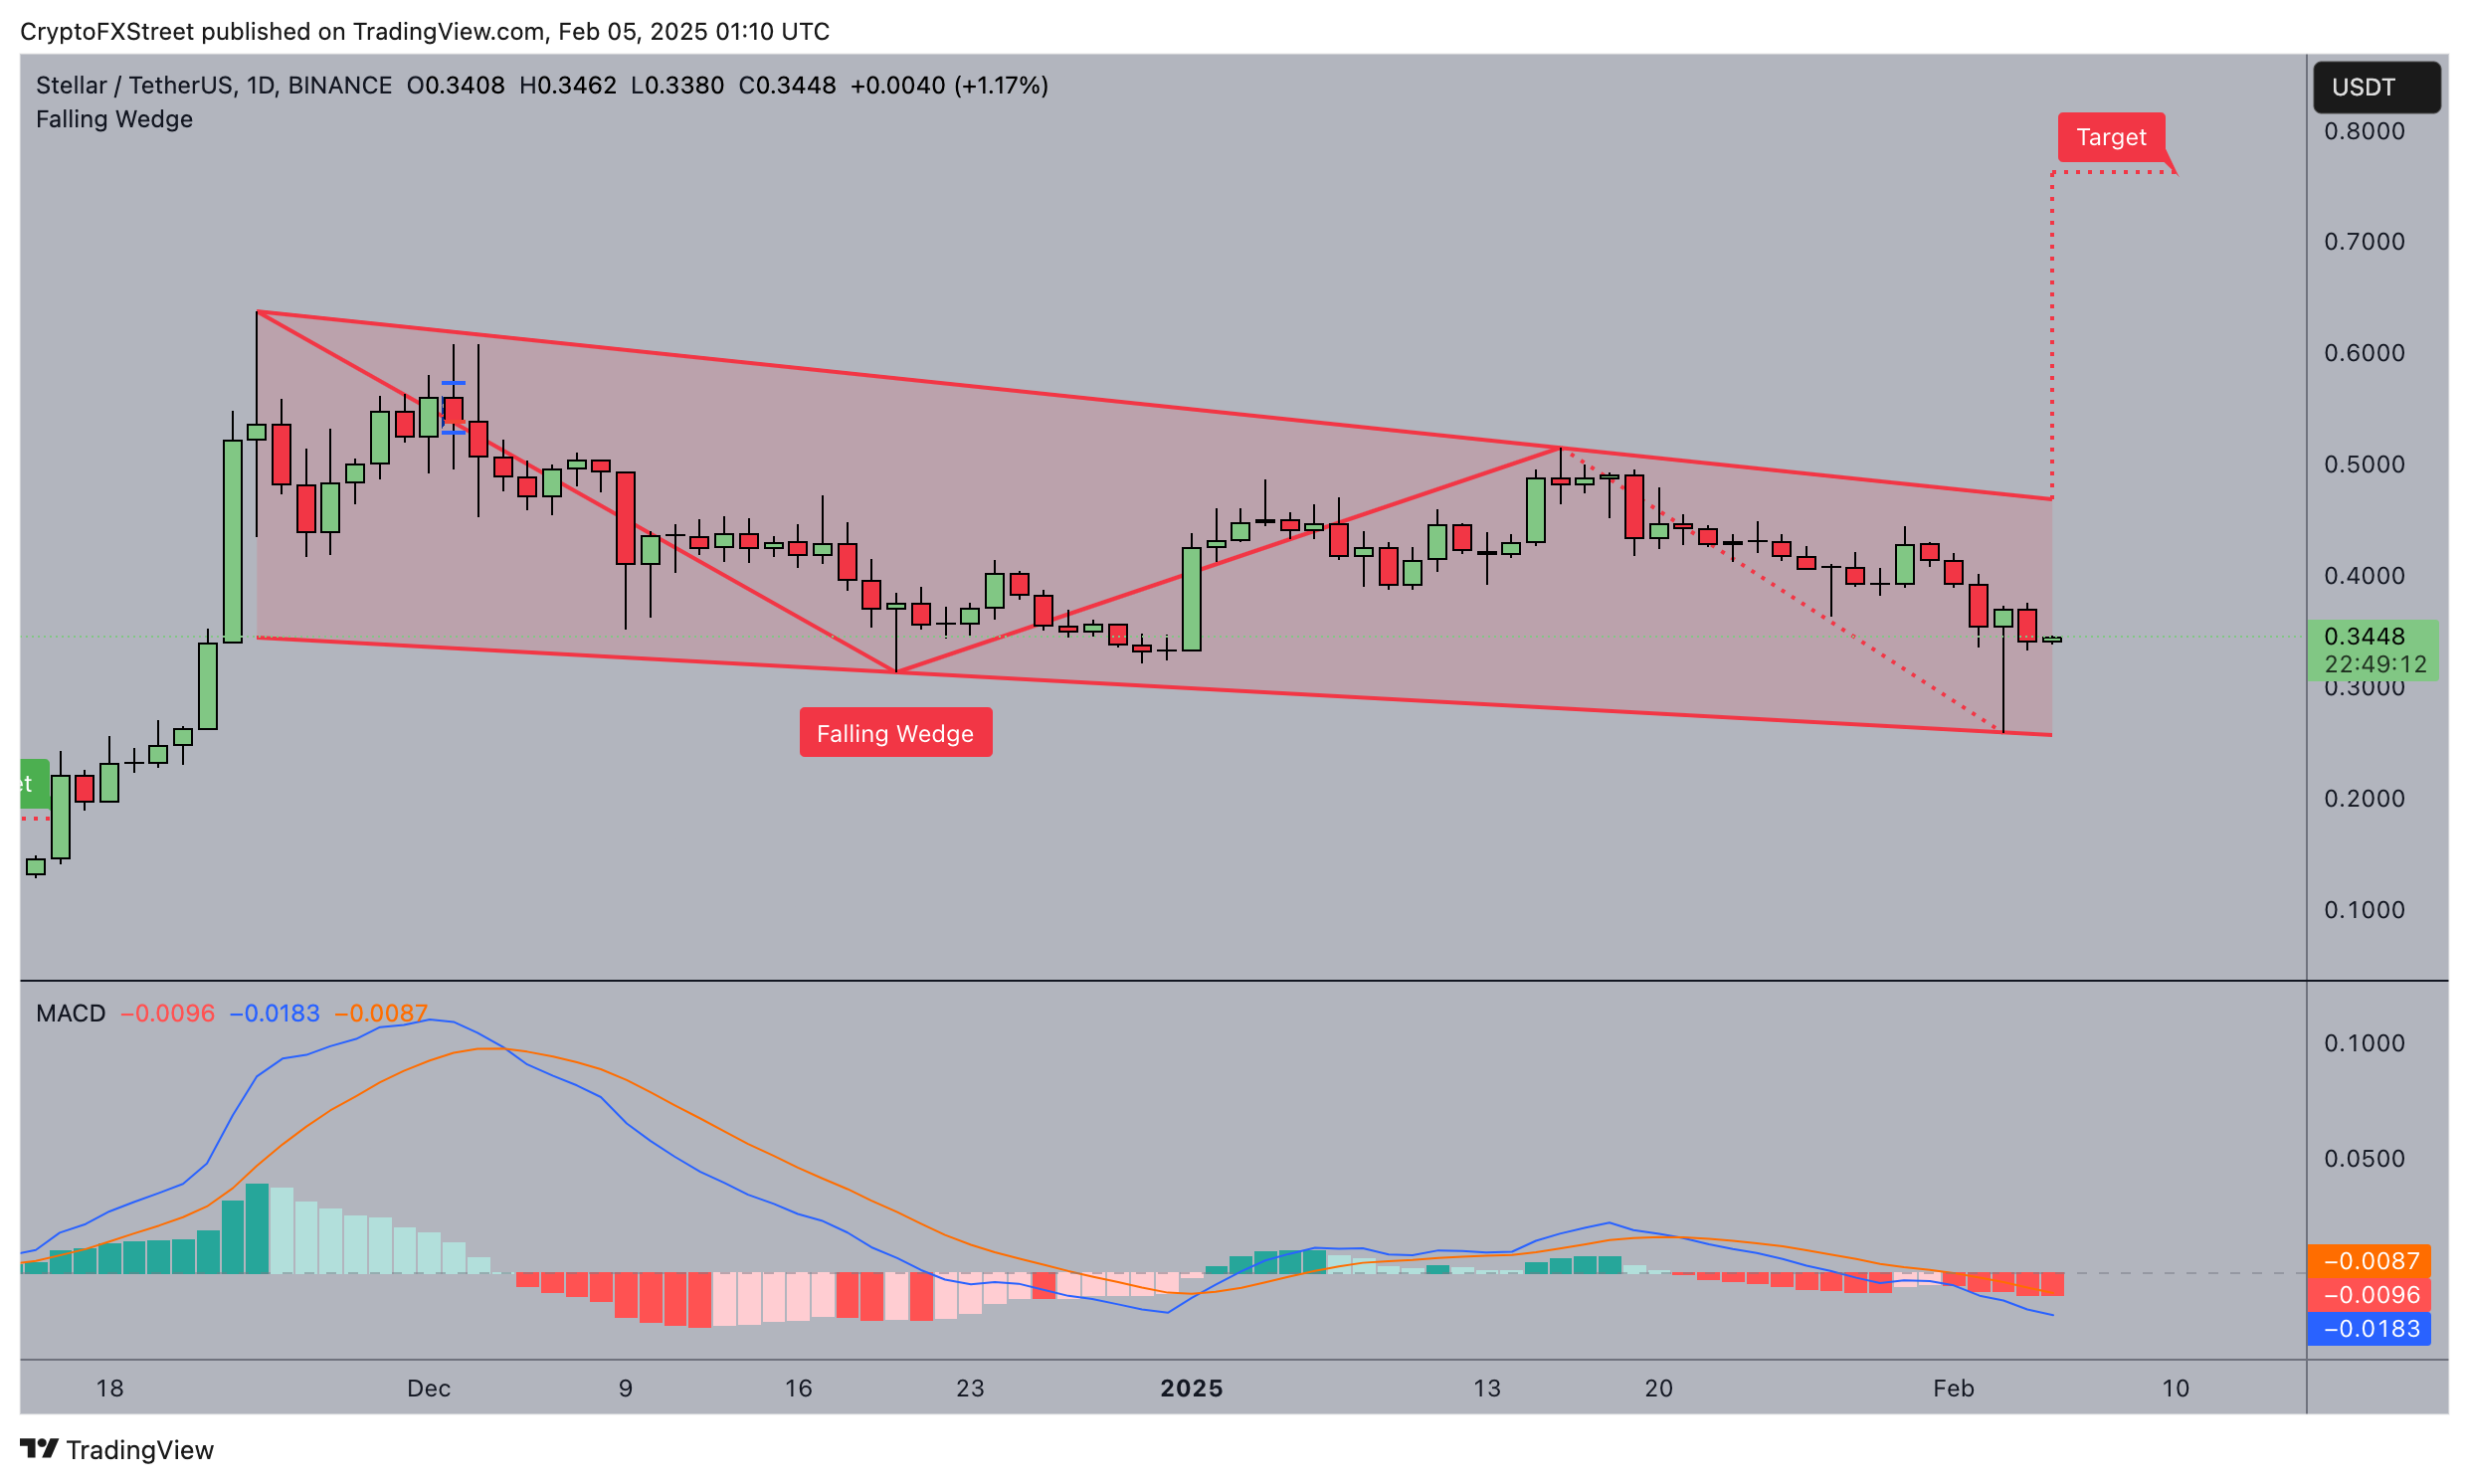
Stellar (XLM) Price Forecast
Momentum indicators further support this bullish case.
The MACD histogram is printing shallow red bars, suggesting weakening bearish momentum, while the MACD line is poised for a potential bullish crossover.
This scenario, combined with increasing trading volume, could amplify upward momentum toward the projected target.
Conversely, failure to reclaim the $0.40 resistance could expose XLM to further consolidation or a bearish fake out, potentially retesting support near $0.30.
However, despite the visible growth trajectory in Stellar's fundamental indicators, XLM’ short term price prospects still largely depends on the broader markets stability.
Information on these pages contains forward-looking statements that involve risks and uncertainties. Markets and instruments profiled on this page are for informational purposes only and should not in any way come across as a recommendation to buy or sell in these assets. You should do your own thorough research before making any investment decisions. FXStreet does not in any way guarantee that this information is free from mistakes, errors, or material misstatements. It also does not guarantee that this information is of a timely nature. Investing in Open Markets involves a great deal of risk, including the loss of all or a portion of your investment, as well as emotional distress. All risks, losses and costs associated with investing, including total loss of principal, are your responsibility. The views and opinions expressed in this article are those of the authors and do not necessarily reflect the official policy or position of FXStreet nor its advertisers. The author will not be held responsible for information that is found at the end of links posted on this page.
If not otherwise explicitly mentioned in the body of the article, at the time of writing, the author has no position in any stock mentioned in this article and no business relationship with any company mentioned. The author has not received compensation for writing this article, other than from FXStreet.
FXStreet and the author do not provide personalized recommendations. The author makes no representations as to the accuracy, completeness, or suitability of this information. FXStreet and the author will not be liable for any errors, omissions or any losses, injuries or damages arising from this information and its display or use. Errors and omissions excepted.
The author and FXStreet are not registered investment advisors and nothing in this article is intended to be investment advice.
Recommended Content
Editors’ Picks

Cardano Price Forecast: ADA set for 20% rally as bullish bets increase
Cardano (ADA) price extends its rally on Monday after gaining more than 13% last week. On-chain metrics suggest a bullish picture as ADA’s long-to-short ratio reached the highest level in over a month.

Top 3 Price Prediction Bitcoin, Ethereum, Ripple: BTC, ETH hold steady while XRP gains momentum
Bitcoin (BTC) has been consolidating between $94,000 and $100,000 for almost two weeks. Ethereum (ETH) price follows in BTC’s footsteps and hovers around $2,680, while Ripple (XRP) shows strength and extends its gains on Monday after rallying 14% last week.

Bitcoin (BTC) vs Gold (XAU): Asset Tokenization expert weighs impact of US Inflation on 2025 price trends
Bitcoin price consolidated at $97,000 on Feb 15, down 6% within the monthly time frame, reeling under bearish headwinds from US tariff wars and rising inflation.

Dogecoin (DOGE) Price mirrors XRP rally as SEC acknowledges Grayscale ETF Filings
Dogecoin price surged 3% on Friday, extending its weekly timeframe gains to 17% as ETF speculation gains traction.

Bitcoin: BTC consolidates before a big move
Bitcoin price has been consolidating between $94,000 and $100,000 for the last ten days. US Bitcoin spot ETF data recorded a total net outflow of $650.80 million until Thursday.

The Best Brokers of the Year
SPONSORED Explore top-quality choices worldwide and locally. Compare key features like spreads, leverage, and platforms. Find the right broker for your needs, whether trading CFDs, Forex pairs like EUR/USD, or commodities like Gold.