NST Elliott Wave technical analysis
Today's Elliott Wave analysis provides an update on the Australian Stock Exchange (ASX) with a focus on NORTHERN STAR RESOURCES LTD (NST).
We identify upside potential in ASX:NST, though we anticipate a pullback with the ((ii))-navy wave first. Additional time may be required before wave ((iii))-navy moves higher. This analysis includes key visual price points to help readers determine when the trend is shifting or when the structure becomes invalidated.
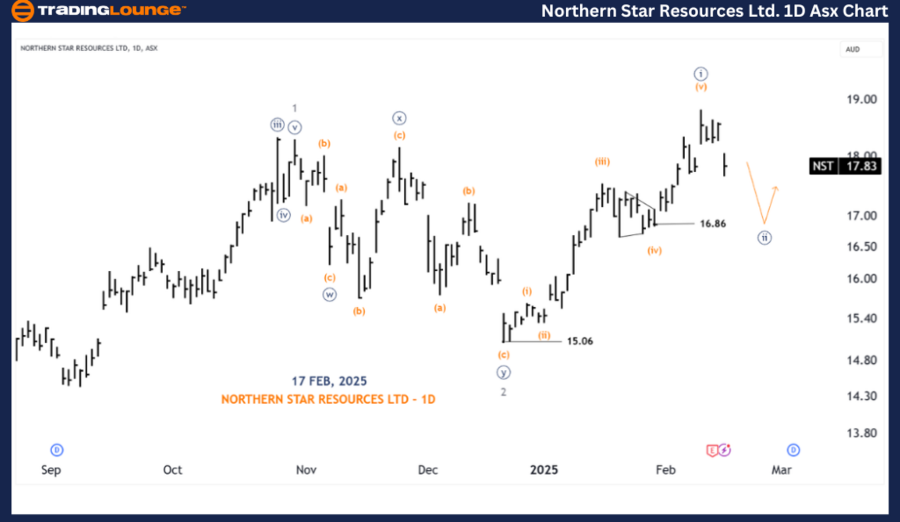
ASX: NST Elliott Wave technical analysis – One-day chart (semilog scale)
-
Function: Major trend (Intermediate degree, orange).
-
Mode: Motive.
-
Structure: Impulse.
-
Position: Wave ((ii))-navy.
Details:
-
Wave ((i))-navy appears to have recently completed a five-wave formation.
-
Wave ((ii))-navy may now be developing downward, targeting the 16.86 support level.
-
Once completed, wave ((iii))-navy is expected to resume an upward trend.
-
Invalidation point: 15.06
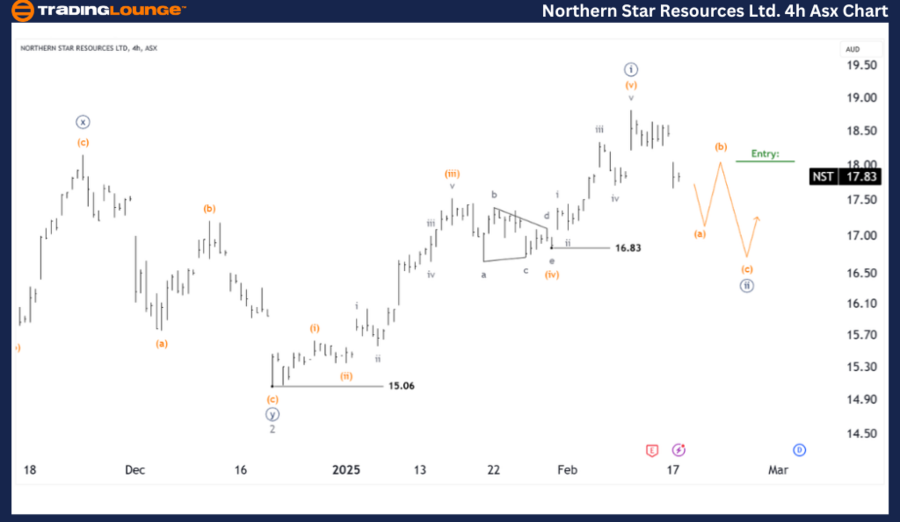
ASX: NST Elliott Wave technical analysis – Four-hour chart
-
Function: Major trend (Minute degree, navy).
-
Mode: Motive.
-
Structure: Impulse.
-
Position: Wave (a)-orange of Wave ((ii))-navy.
Details:
-
Wave ((ii))-navy has yet to reach its target of 16.83, suggesting further downside movement.
-
The structure may continue to decline in an ABC formation before reversing.
-
A strategic entry point may be at the completion of wave (b)-orange, providing an opportunity for a quality long trade.
-
Invalidation point: 15.06.
-
Key Point: The completion of Wave (b)-orange.
Conclusion
This analysis of ASX: NORTHERN STAR RESOURCES LTD (NST) provides insights into current market trends and strategies to capitalize on them. By identifying key price levels that confirm or invalidate our wave count, we enhance the accuracy of our forecast. Our approach delivers an objective and professional outlook, enabling traders to make well-informed decisions.
Northern Star Resources Ltd (NST) analysis and Elliott Wave forecast [Video]
As with any investment opportunity there is a risk of making losses on investments that Trading Lounge expresses opinions on.
Historical results are no guarantee of future returns. Some investments are inherently riskier than others. At worst, you could lose your entire investment. TradingLounge™ uses a range of technical analysis tools, software and basic fundamental analysis as well as economic forecasts aimed at minimizing the potential for loss.
The advice we provide through our TradingLounge™ websites and our TradingLounge™ Membership has been prepared without considering your objectives, financial situation or needs. Reliance on such advice, information or data is at your own risk. The decision to trade and the method of trading is for you alone to decide. This information is of a general nature only, so you should, before acting upon any of the information or advice provided by us, consider the appropriateness of the advice considering your own objectives, financial situation or needs. Therefore, you should consult your financial advisor or accountant to determine whether trading in securities and derivatives products is appropriate for you considering your financial circumstances.
Recommended content
Editors’ Picks

EUR/USD stays defensive below 1.0500 amid light trading
EUR/USD struggles to capitalize on recent upside and oscillates in a narrow range below 1.0500 in European trading on Monday. However, the pair's downside remains cushioned by persistent US Dollar weakness and an upbeat mood. Focus shifts to central bank talks.

GBP/USD ranges near 1.2600 as US Dollar steadies
GBP/USD keeps its range near 1.2600 in the early European session on Monday. The pair stays support amid a subdued US Dollar price action following Friday's disappoining US Retail Sales data. Thin trading is likely to extend as US markets are closed in observance of Presidents' Day.

Gold: Bulls have the upper hand near $2,900 amid trade war fears and weaker USD
Gold regained positive traction on Monday amid sustained USD weakness. Concerns about Trump’s tariffs further benefit the safe-haven XAU/USD pair. The fundamental and technical setup underpin prospects for additional gains.

Cardano set for 20% rally as bullish bets increase
Cardano price extends its rally on Monday after gaining more than 13% last week. On-chain metrics suggest a bullish picture as ADA’s long-to-short ratio reached the highest level in over a month.

Tariffs likely to impart a modest stagflationary hit to the economy this year
The economic policies of the Trump administration are starting to take shape. President Trump has already announced the imposition of tariffs on some of America's trading partners, and we assume there will be more levies, which will be matched by foreign retaliation, in the coming quarters.

The Best Brokers of the Year
SPONSORED Explore top-quality choices worldwide and locally. Compare key features like spreads, leverage, and platforms. Find the right broker for your needs, whether trading CFDs, Forex pairs like EUR/USD, or commodities like Gold.