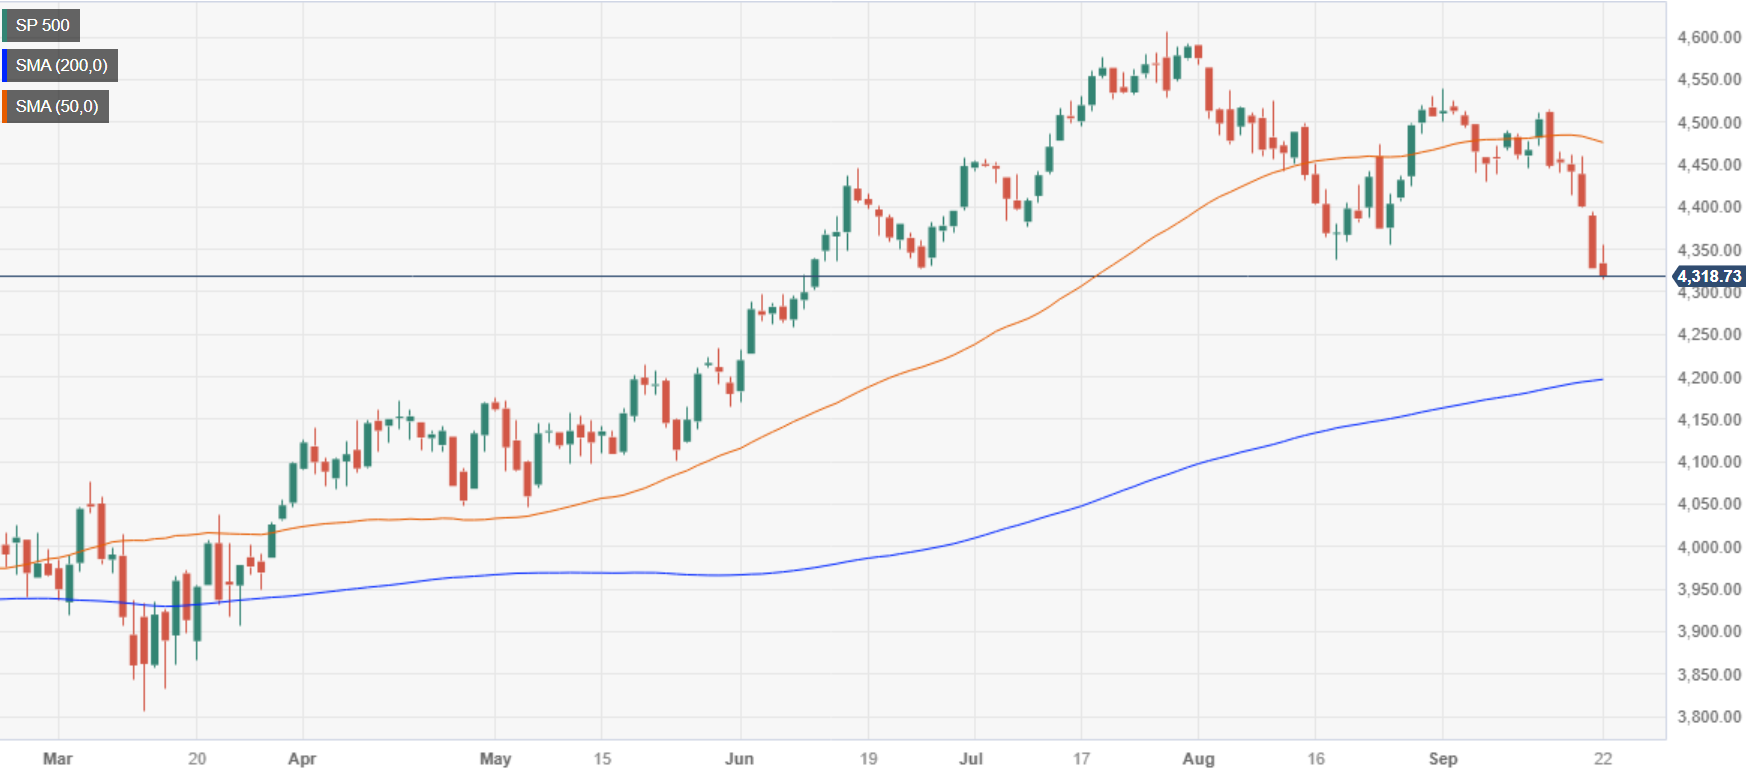
- S&P 500 concluded the week at 4,320.06, marking a 0.23% daily and a 3.02% weekly drop, reaching levels last seen in June, with Nasdaq and Dow Jones also incurring losses
- Federal Reserve’s decision to hold rates but revise upward projections for the Federal Funds rate for 2023 and 2024 spurred a sharp reaction in financial markets.
- Sector-wise, Technology and Energy emerged as gainers, while Consumer Discretionary, Financials, and Real Estate were the laggards.
Wall Street finished the week on a lower note, mixed with the S&P 500, the Nasdaq, and the Dow Jones printing losses. Additionally, US equities plunged, led by the S&P 500 dropping to levels last seen in June.
S&P 500 plunges weekly, Nasdaq and Dow follow suit, as markets react to Federal Reserve’s upward revision of Federal Funds Rate projections
The S&P finished Friday’s session at 4,320.06, dropping 0.23%, but plunged -3.02% weekly. The heavy-tech Nasdaq edged lower by a minimal 0.09% and sank 3.21% weekly, while the Dow Jones Industrial dived 0.31% at 33,963.84 and slumped -1.89% in the week.
Sector-wise, the biggest gainers were Technology and Energy, each gained 0.26% and 0.15%. The laggards were Consumer Discretionary, Financials, and Real Estate, erasing from its value 0.87%, 0.74%, and 0.72%, respectively.
During the week, the Federal Reserve held the sixth monetary policy meeting, in which the US central bank decided to hold rates but upward revised their projections to the Federal Funds rate (FFR). For 2023, policymakers expect the FFR to end at 5.60%; for 2024, they increased their estimates from 4.6% to 5.1%.
The data spurred an aggressive reaction in the financial markets, with US equities plummeting sharply after hitting fresh weekly highs. US Treasury bond yields touched 16-year highs, led by 2s, 5s and 10s. Nevertheless, as traders booked profits before the weekend, US bond yields retraced, though they failed to undermine the Greenback.
Data-wise, S&P Global announced the final PMI readings in the United States (US). Manufacturing PMI improved to 48.9 but stood at recessionary territory. Contrarily, Services and Composite PMI showed signs of losing steam, though it expanded but continued to aim towards the 50 expansion/contraction threshold.
US Treasury bond yields finished the session with the 10-year benchmark note rate at 4.36%, lost 1.33%. The Greenback, as shown by the US Dollar Index, ended positively, climbing 0.19% to 105.58.
WTI rose by 0.85% daily in the commodity space underpinned by tight supply concerns stemming from Russia’s fuel export ban.
S&P 500 Price Action – Daily Chart
S&P 500 Technical Levels
Information on these pages contains forward-looking statements that involve risks and uncertainties. Markets and instruments profiled on this page are for informational purposes only and should not in any way come across as a recommendation to buy or sell in these assets. You should do your own thorough research before making any investment decisions. FXStreet does not in any way guarantee that this information is free from mistakes, errors, or material misstatements. It also does not guarantee that this information is of a timely nature. Investing in Open Markets involves a great deal of risk, including the loss of all or a portion of your investment, as well as emotional distress. All risks, losses and costs associated with investing, including total loss of principal, are your responsibility. The views and opinions expressed in this article are those of the authors and do not necessarily reflect the official policy or position of FXStreet nor its advertisers. The author will not be held responsible for information that is found at the end of links posted on this page.
If not otherwise explicitly mentioned in the body of the article, at the time of writing, the author has no position in any stock mentioned in this article and no business relationship with any company mentioned. The author has not received compensation for writing this article, other than from FXStreet.
FXStreet and the author do not provide personalized recommendations. The author makes no representations as to the accuracy, completeness, or suitability of this information. FXStreet and the author will not be liable for any errors, omissions or any losses, injuries or damages arising from this information and its display or use. Errors and omissions excepted.
The author and FXStreet are not registered investment advisors and nothing in this article is intended to be investment advice.
Recommended content
Editors’ Picks
EUR/USD stabilizes near 1.0500, looks to post weekly losses

EUR/USD extended its daily decline toward 1.0500 in the second half of the American session, pressured by the souring market mood. Despite the bullish action seen earlier in the week, the pair remains on track to register weekly losses.
GBP/USD falls below 1.2150 as USD rebounds

Following an earlier recovery attempt, GBP/USD turned south and declined below 1.2100 in the second half of the day on Friday. The negative shift seen in risk mood amid rising geopolitical tensions helps the US Dollar outperform its rivals and hurts the pair.
Gold advances to fresh multi-week highs above $1,920

Gold extended its daily rally and climbed above $1,920 for the first time in over two weeks on Friday. Escalating geopolitical tensions ahead of the weekend weigh on T-bond yields and provide a boost to XAU/USD, which remains on track to gain nearly 5% this week.
Bitcoin could be an alternative to US-listed companies but not in the short term

Bitcoin has dipped below $27,000, adding to the subdued cryptocurrency market sentiment. While short-term price concerns persist, analysts predict a rebound based on historical figures.
Nvidia Stock Forecast: NVDA slips as Biden administration attempts to close AI chip loophole
Nvida's stock price opened marginally lower on Friday after Reuters reported that the Biden administration is attempting to close a loophole that allowed Chinese companies access to state-of-the-art computer chips used for AI.
