I am a big proponent of correlations. Finding a correlation between two assets that move almost identical is great, but my favorite type of correlation is when one asset leads another. That allows you to trade the asset that is lagging with a lot more confidence. I have discovered a very technical correlation between two different US dollar indices that will allow you to trade the EUR/GBP: the DXY and the FXCM dollar.
First, to understand this correlation we must look at how these two indices are calculated. The DXY measures the dollar against a basket of six major currencies, with a heavy weighting in the euro. The euro makes up almost 58% of the DXY, so it accounts for a lot of its movement. The other 5 currencies are around 10%, give or take. The FXCM dollar index has an equal 25% weighting between four major currencies: the pound, euro, yen, and aussie. The difference in calculations between these two indices causes different currencies to follow one index more closely than the other.
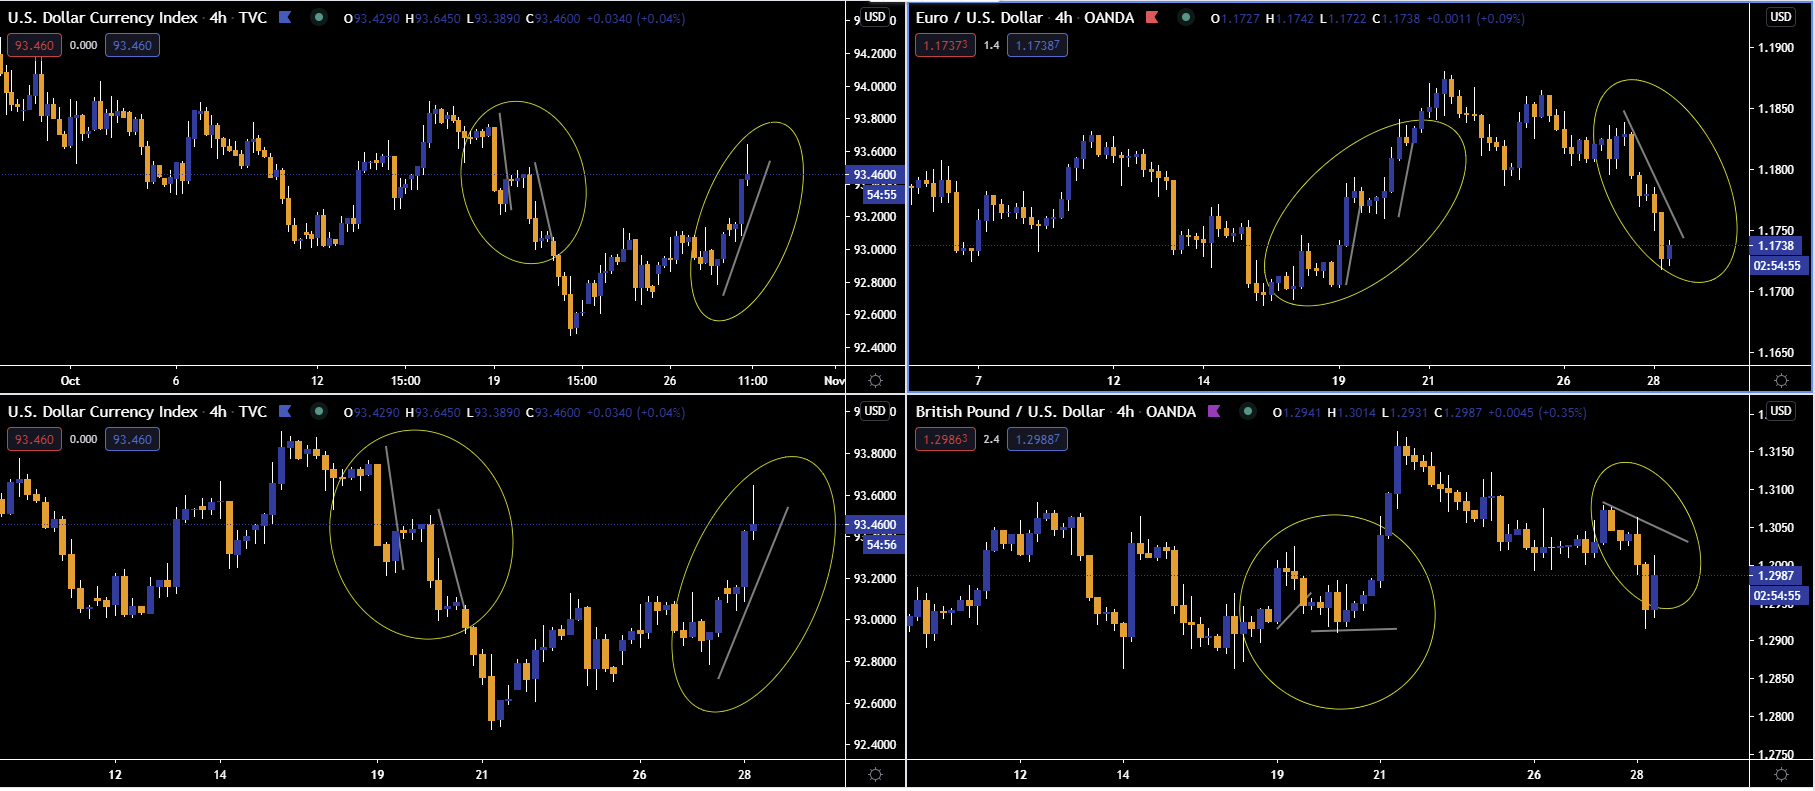
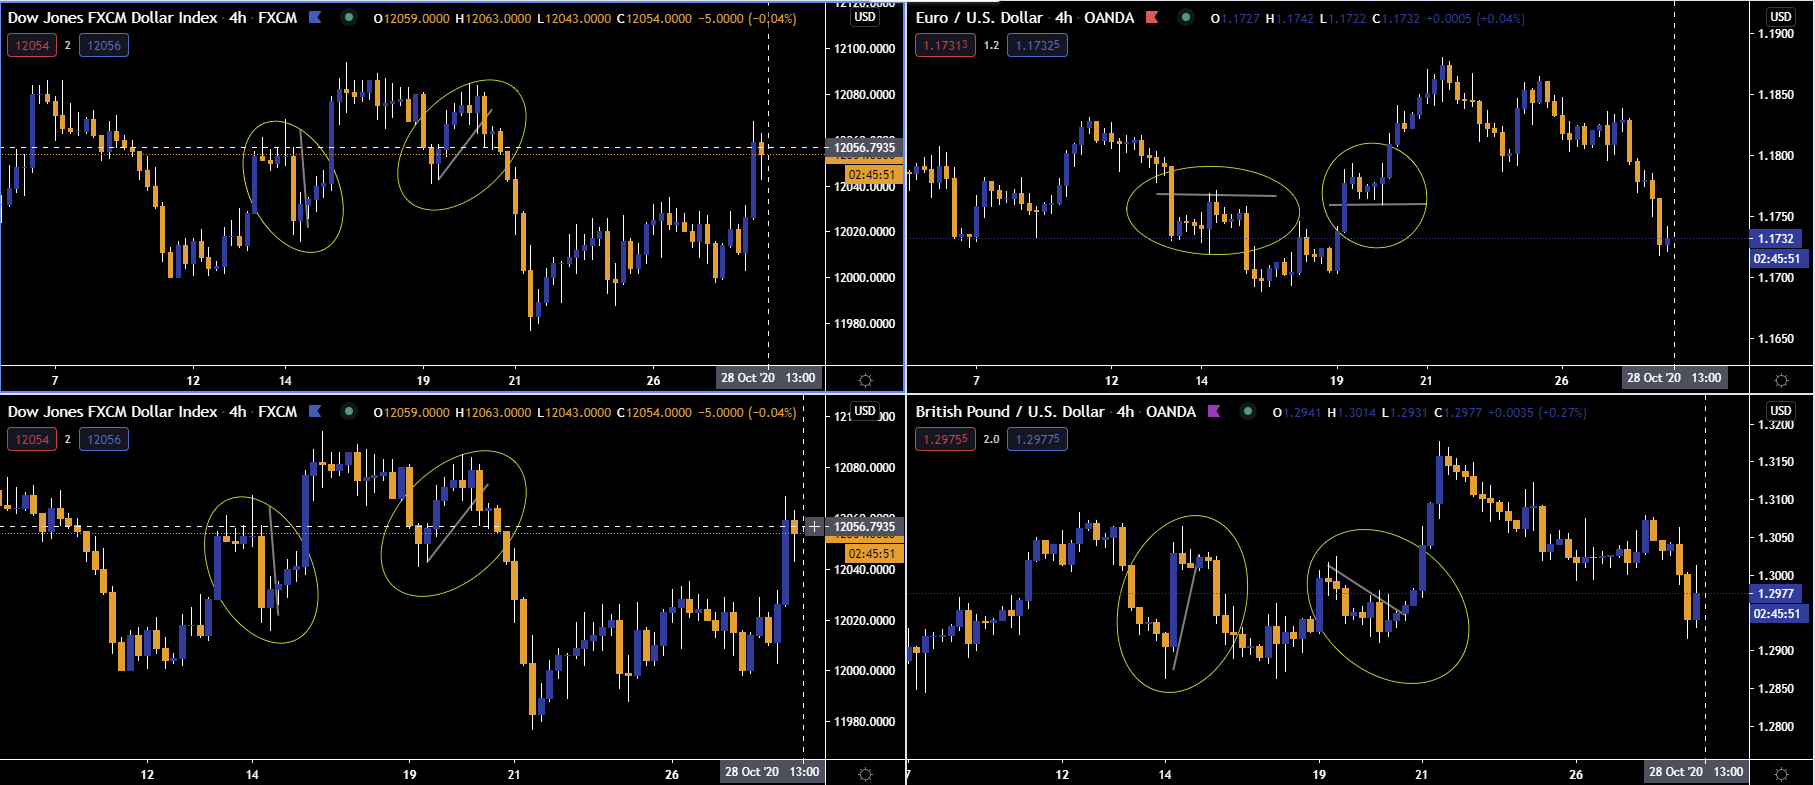
The euro has a stronger inverse relationship with the DXY than it does the FXCM dollar, since it makes up 58% of the DXY and only 25% of the FXCM dollar. Whereas, the pound has a stronger inverse relationship with the FXCM dollar than it does the DXY, since the pound makes up 25% of the FXCM dollar but only about 12% of the DXY. In the chart below, I have put the EUR/USD and GBP/USD side-by-side with the DXY to show there is a much closer inverse relationship between the euro and DXY, than there is the pound and DXY. Also, below that I have the same two currency pairs side-by-side with the FXCM dollar to show the pound has a much closer inverse relationship with it than the euro does. You will notice that sometimes the moves in the euro and pound are nearly identical, but often enough you will see the above mentioned relationship play out, on any time frame. The charts displayed below are just to give you a visual of what I am talking about. We are going to take a more granular look at this relationship in just a moment.
Now, the two dollar indexes move in the same direction, as you can see, but one is usually stronger/weaker than the other. Depending on that strength/weakness, it will determine which direction the EURGBP goes in.
- If the DXY is stronger than the FXCM dollar, that means the euro will be weaker than the pound. Put another way, if the FXCM dollar is weaker than the DXY, the pound will be stronger than the euro. EUR/GBP short is the play.
- If the FXCM dollar is stronger than the DXY, that means the pound will be weaker than the euro. Put another way, if the DXY is weaker than the FXCM dollar, the euro will be stronger than the pound. EUR/GBP long is the play.
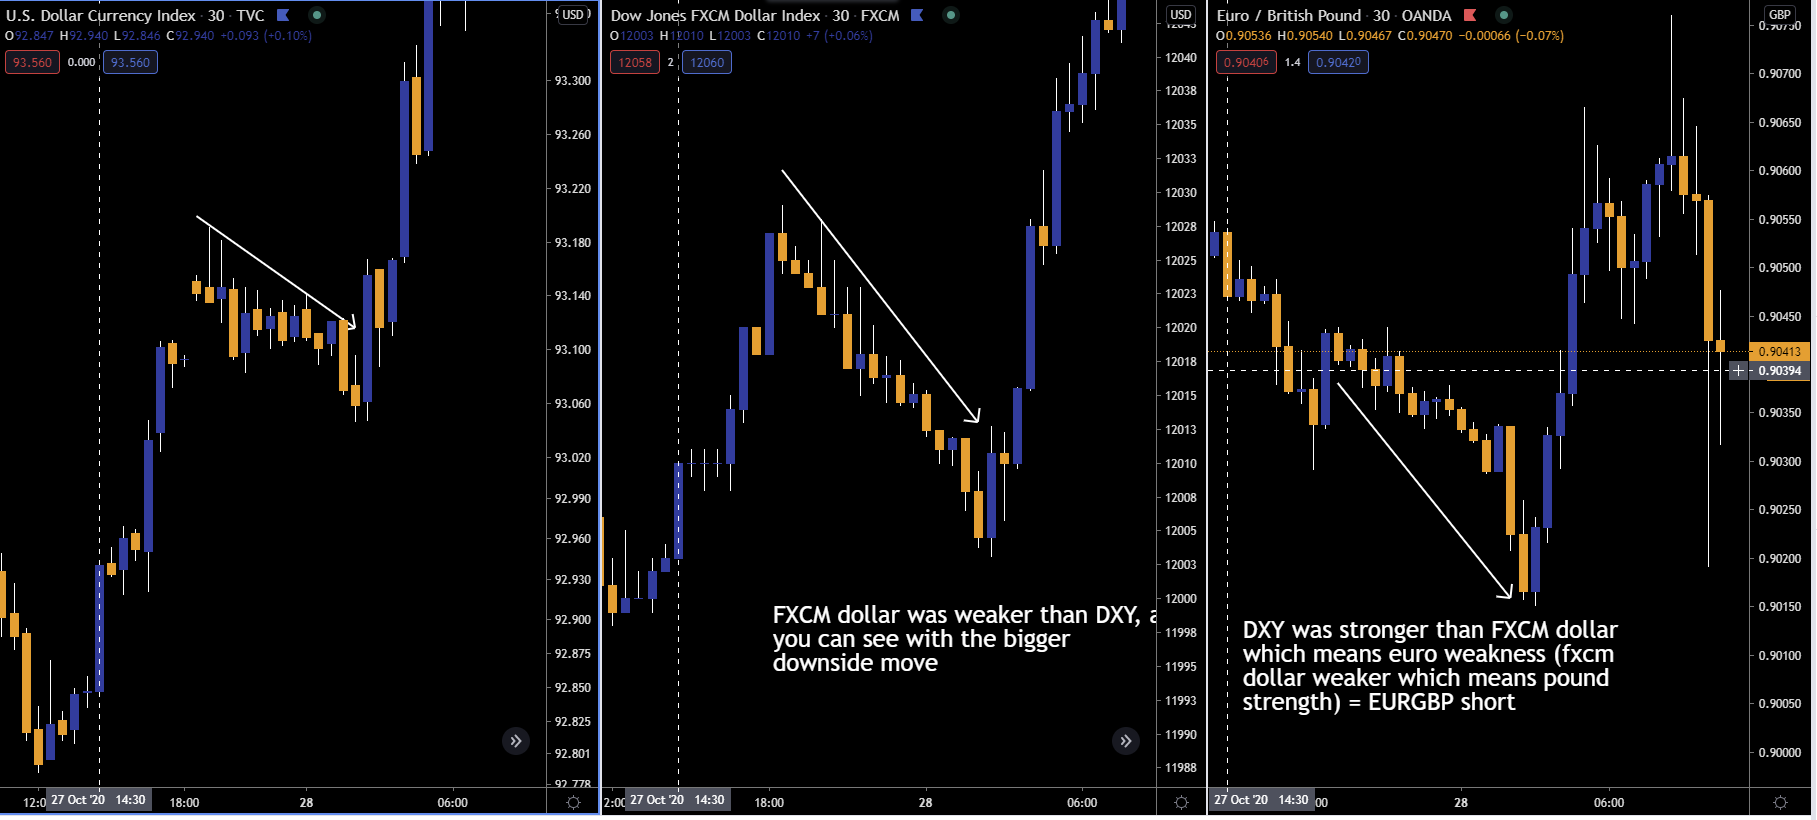
Let’s take a look at some examples of how the strength/weakness in the two dollar indices determine the direction of the EUR/GBP. In the first chart below, you can clearly see (indicated by the arrows) that the FXCM dollar’s move down was a lot sharper than that of the DXY’s. That means the FXCM dollar was weaker than the DXY (DXY was stronger than FXCM dollar) which meant the pound would be stronger than the euro (euro weaker than the pound). The result was a move lower in the EUR/GBP.
The EURGBP then reversed its position, alongside the dollar indices. As noted on the chart (below), the FXCM had more buy pressure step into the market than the DXY did. There was then follow through as the FXCM dollar broke the previous candle’s high with some force, whereas the DXY barely broke the previous candle’s high. This showed that the strength that was previously (chart above) in the DXY flowed into the FXCM dollar. If the FXCM dollar is stronger than the DXY (DXY weaker than the FXCM dollar), we should see pound weakness against the euro. The result, was a EUR/GBP long.
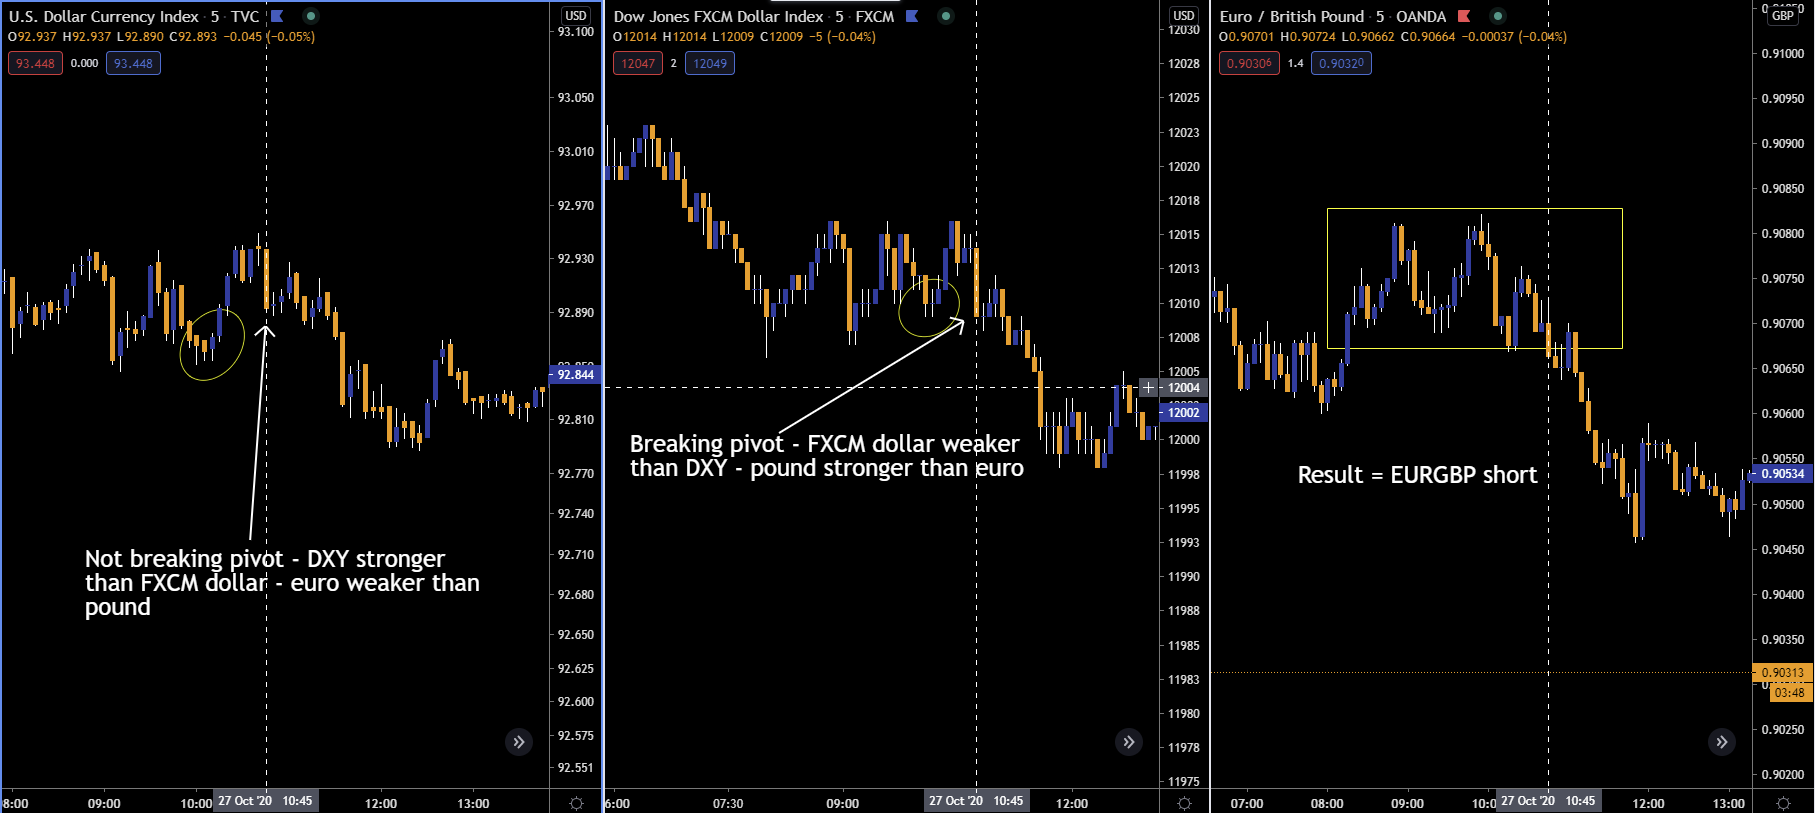
To look at it a different way, on the chart below, I identified the strength/weakness in the dollar indices by analyzing which one was breaking pivots (either highs or lows) and which one was not. The 5m candle at 10:45 was breaking a pivot (circled) on the FXCM dollar to the downside, but on the DXY it was failing to break its equivalent pivot low (circled). This indicated that the DXY was stronger than the FXCM dollar (FXCM dollar weaker than DXY), which means the euro should be weaker against the pound. At the same time, the EUR/GBP broke out of its consolidation to the downside, right in line with the DXY strength versus the FXCM dollar.
A lot of the moves that determine which dollar index is stronger/weaker is subtle, but it is there, you just have to train you eye to see it. Also, sometimes the moves in the dollar indices occur at the same time as the move in the EUR/GBP. But, often enough you will be able to determine the strength/weakness in the dollar indices prior to the move in the EUR/GBP. When that happens, it makes it even easier to trade, because the dollar indices are leading the EUR/GBP, giving you its direction before the move happens. Just remember, this analysis can be applied to any time frame and that any move is only relative to the time frame(s) you are looking at.
When performing this analysis you should consider a few things: the angle of the moves – which index has a sharper move? Is one index breaking highs or lows while the other is not? Is one index breaking pivots while the other is not? Is one index creating a stronger buying or selling candle compared to the other? These are the things I look for. But, I never just find one piece of evidence and base a trade off of it. I like to have multiple pieces of evidence to tell me which index is stronger/weaker and then wait for the EUR/GBP to confirm that direction before entering a position, like in the example above.
We just looked at the euro and pound today, but you can get more creative with this analysis. It can be used to trade certain cross pairs, as well as to determine which dollar-based pair will have the cleanest move. I won’t get into that here because what I have gone over is a lot to absorb, but I will in a later article.
There is substantial risk associated with trading in the financial markets. You are solely responsible for your own financial decisions. Information on Ryan Miller Trading Economics is for educational purposes only. Ryan Miller Trading Economics will not be held responsible for any losses you incur. Ryan Miller Trading Economics does not provide any trading advice and is not a professional investment service. Past performance is not necessarily indicative of future results. There is a substantial risk of loss associated with trading currencies, securities, options, futures, equities and options on futures and currencies. Currencies, Futures, Options, Bonds, Equities and other securities trading all have large potential rewards, but they also have large potential risk and may result in monetary losses. You must be aware of the risks and be willing to accept them in order to invest or trade in these markets. Ryan Miller Trading Economics is neither a solicitation nor an offer to Buy/Sell currencies, futures, options, bonds, or equities. No representation is being made that any account will or is likely to achieve profits or losses similar to those discussed on this website. The past performance of any trading system or methodology is not necessarily indicative of future results.
Editors’ Picks
EUR/USD stabilizes near 1.0500, looks to post weekly losses

EUR/USD extended its daily decline toward 1.0500 in the second half of the American session, pressured by the souring market mood. Despite the bullish action seen earlier in the week, the pair remains on track to register weekly losses.
GBP/USD falls below 1.2150 as USD rebounds

Following an earlier recovery attempt, GBP/USD turned south and declined below 1.2100 in the second half of the day on Friday. The negative shift seen in risk mood amid rising geopolitical tensions helps the US Dollar outperform its rivals and hurts the pair.
Gold advances to fresh multi-week highs above $1,920

Gold extended its daily rally and climbed above $1,920 for the first time in over two weeks on Friday. Escalating geopolitical tensions ahead of the weekend weigh on T-bond yields and provide a boost to XAU/USD, which remains on track to gain nearly 5% this week.
Bitcoin could be an alternative to US-listed companies but not in the short term

Bitcoin has dipped below $27,000, adding to the subdued cryptocurrency market sentiment. While short-term price concerns persist, analysts predict a rebound based on historical figures.
Nvidia Stock Forecast: NVDA slips as Biden administration attempts to close AI chip loophole
Nvida's stock price opened marginally lower on Friday after Reuters reported that the Biden administration is attempting to close a loophole that allowed Chinese companies access to state-of-the-art computer chips used for AI.
RECOMMENDED LESSONS
Making money in forex is easy if you know how the bankers trade!
Discover how to make money in forex is easy if you know how the bankers trade!
5 Forex News Events You Need To Know
In the fast moving world of currency markets, it is extremely important for new traders to know the list of important forex news...
Top 10 Chart Patterns Every Trader Should Know
Chart patterns are one of the most effective trading tools for a trader. They are pure price-action, and form on the basis of underlying buying and...
7 Ways to Avoid Forex Scams
The forex industry is recently seeing more and more scams. Here are 7 ways to avoid losing your money in such scams: Forex scams are becoming frequent. Michael Greenberg reports on luxurious expenses, including a submarine bought from the money taken from forex traders. Here’s another report of a forex fraud. So, how can we avoid falling in such forex scams?
What Are the 10 Fatal Mistakes Traders Make
Trading is exciting. Trading is hard. Trading is extremely hard. Some say that it takes more than 10,000 hours to master. Others believe that trading is the way to quick riches. They might be both wrong. What is important to know that no matter how experienced you are, mistakes will be part of the trading process.


