![]() Rick Wright
Rick Wright
Online Trading Academy
Hello traders! This week’s newsletter will be a short lesson on candlestick stock charts and how to use them for hints on your trades.
First of all, Japanese candlesticks were first invented in Japan hundreds of years ago to try and predict the future price of rice. The interpretation of candlesticks is very fast and efficient, which is why they have remained so popular even in this day and age. There are dozens and dozens of different patterns that exist in the world of candlesticks. I plan on giving you an easy way to interpret the very basics of them to help with your trading.
Every candlestick shows us four data points, the open (first trade in the time period), the high (highest trade in the time period), low (lowest trade in the time period and the close (last trade in the time period). Of these four data points, each is important in its own way, but for this technique we are more interested in the close.
In the following image, you can see that I’ve marked two different candles with blue arrows, One and Two. I’ve also broken down these candles into five equal parts – quintiles. I look at where the candle closes within this range of quintiles to give me a bias of, from very bearish to very bullish.
If the candle closes in the highest quintile, that is very bullish (meaning a strong bias to higher prices).
If the candle closes in the next lower quintile, that is bullish (meaning a bias to higher prices).
If the candle closes in the middle quintile, the bias is neutral.
If the candle closes in the next lower quintile, that is bearish (meaning a bias to lower prices).
If the candle closes in the lowest quintile, that is very bearish (meaning a strong bias to lower prices).
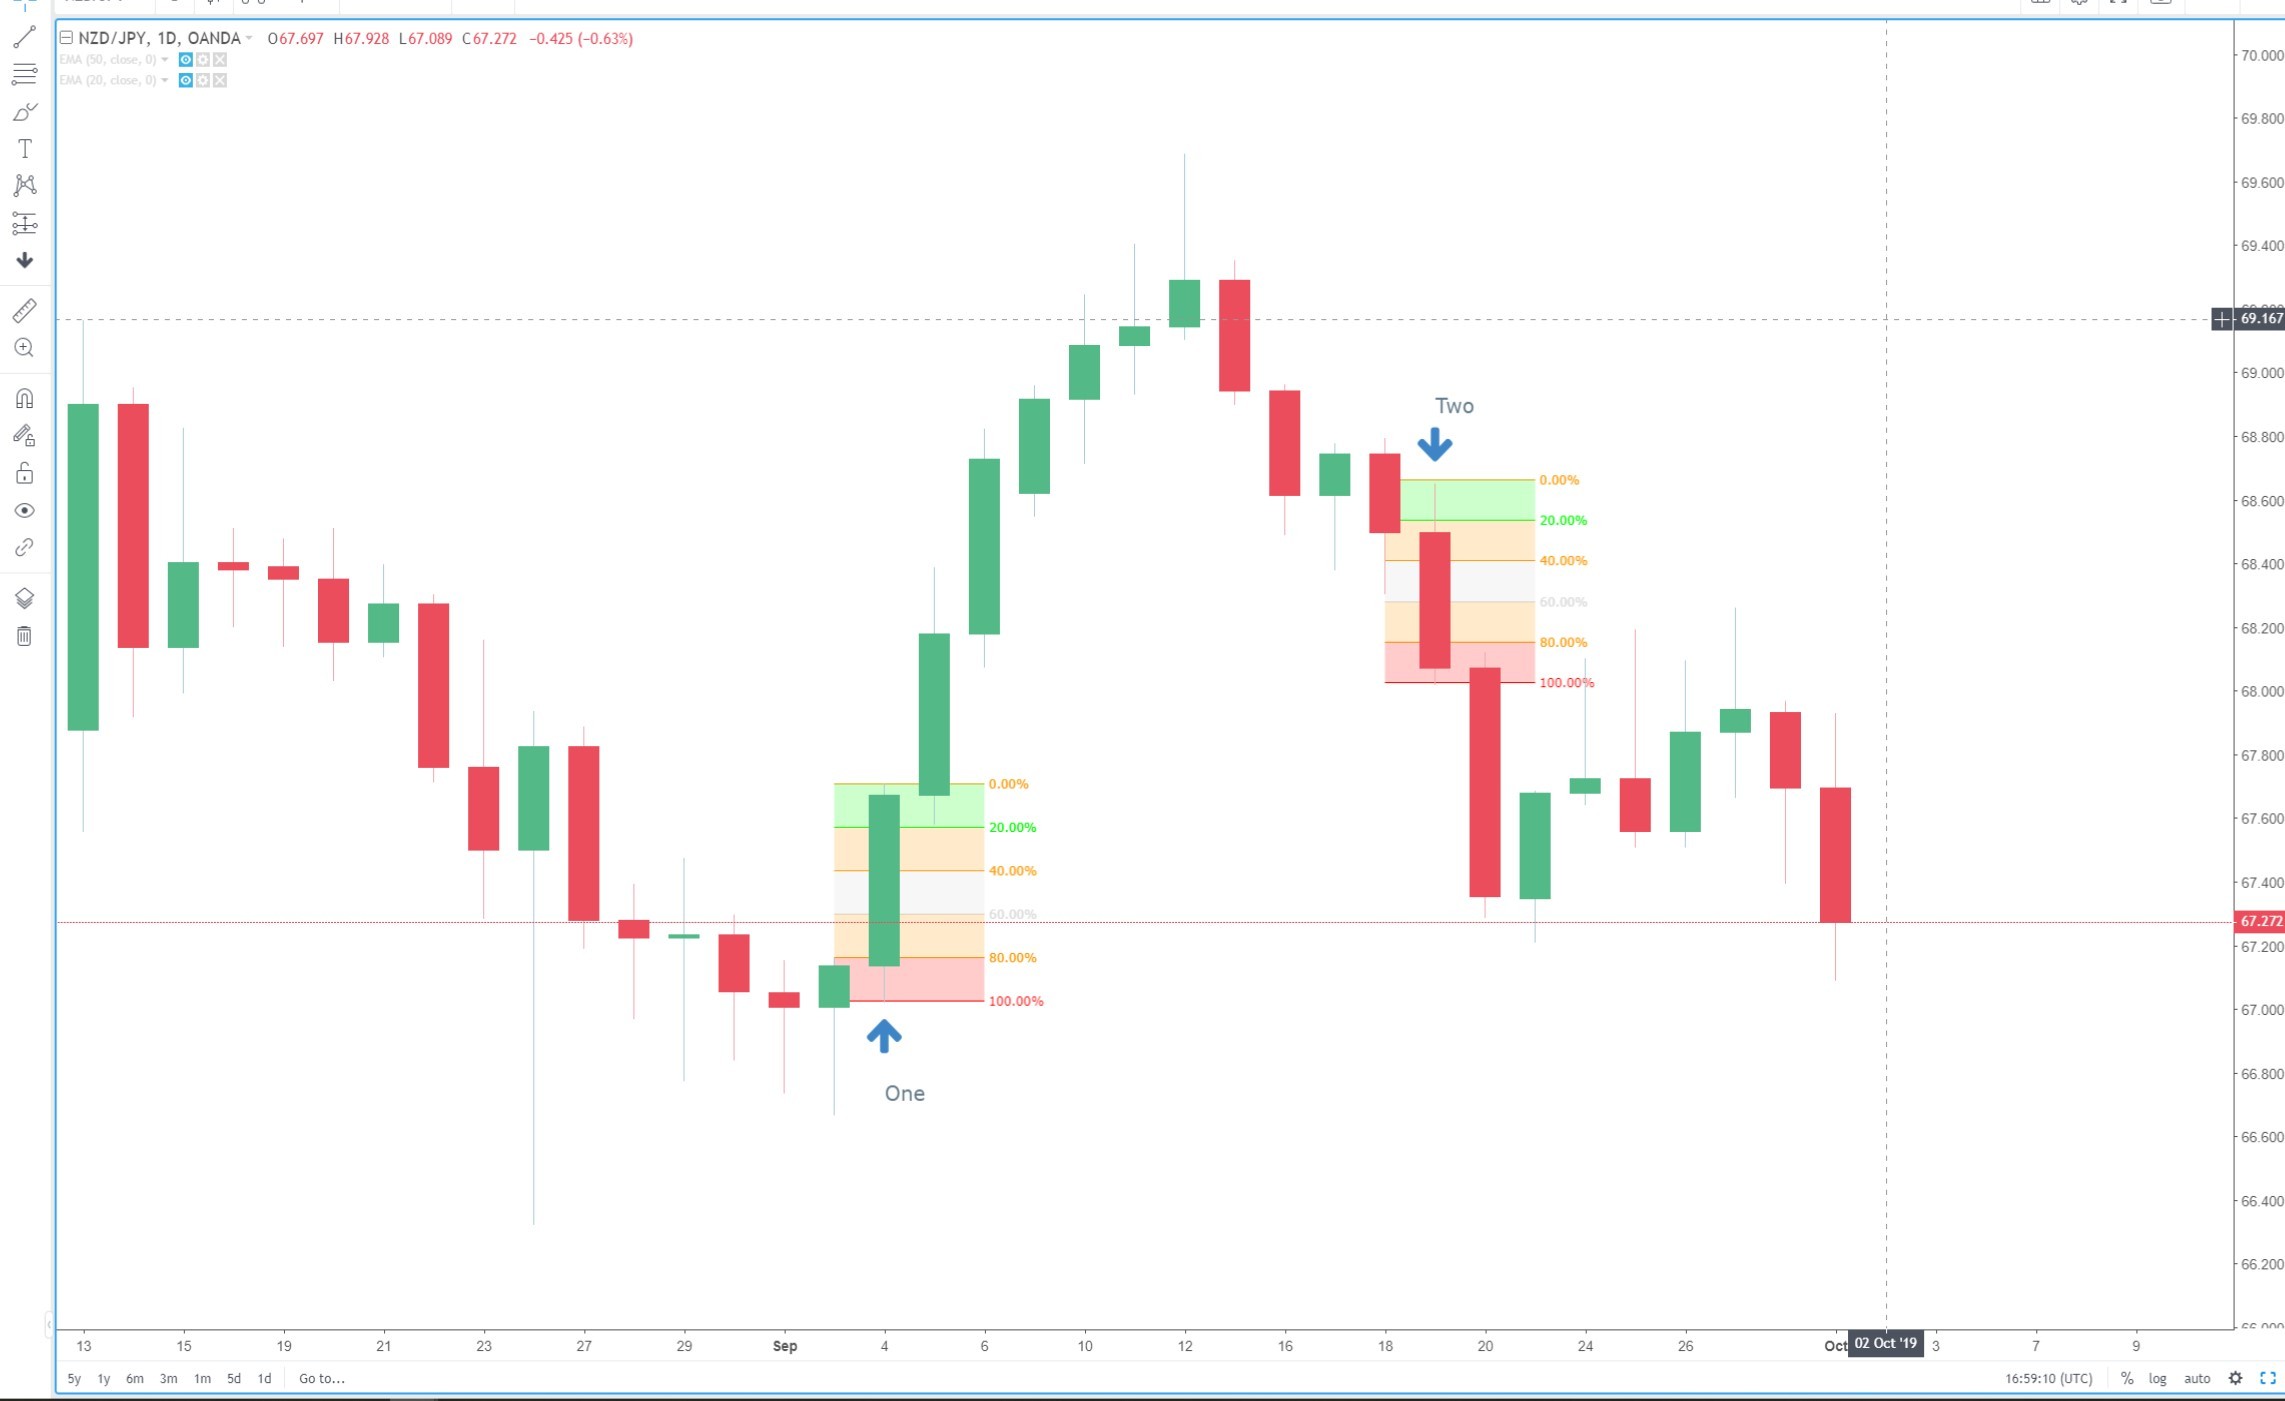
So, on the candle labeled One, it closed in the top quintile giving a very bullish bias/hint for what will happen in the next candle. Lo and behold, the next went up as well! As you look at each of the following green bodied candles, you can see that bullish bias held until the move was nearly complete.
On the candle labeled Two, it closed in the lowest quintile, giving a very bearish bias/hint for what will happen in the next candle. Lo and behold, the next candle went down as well!
Notice the following large red candle closed near the very bottom of its range as well, but the next candle obviously didn’t continue down. Location on the chart is more important than the shape of the candle. What this means is that a very bearish candle after a long move down is much less important than after a long move up! On the other side of the coin, a very bullish candle after a long move up is much less important than after a long move down!
So how can we use this information? On the following image, I have put on two charts of the USDCAD. The chart on the left is a daily chart with the very bearish candle from September 3 marked in.
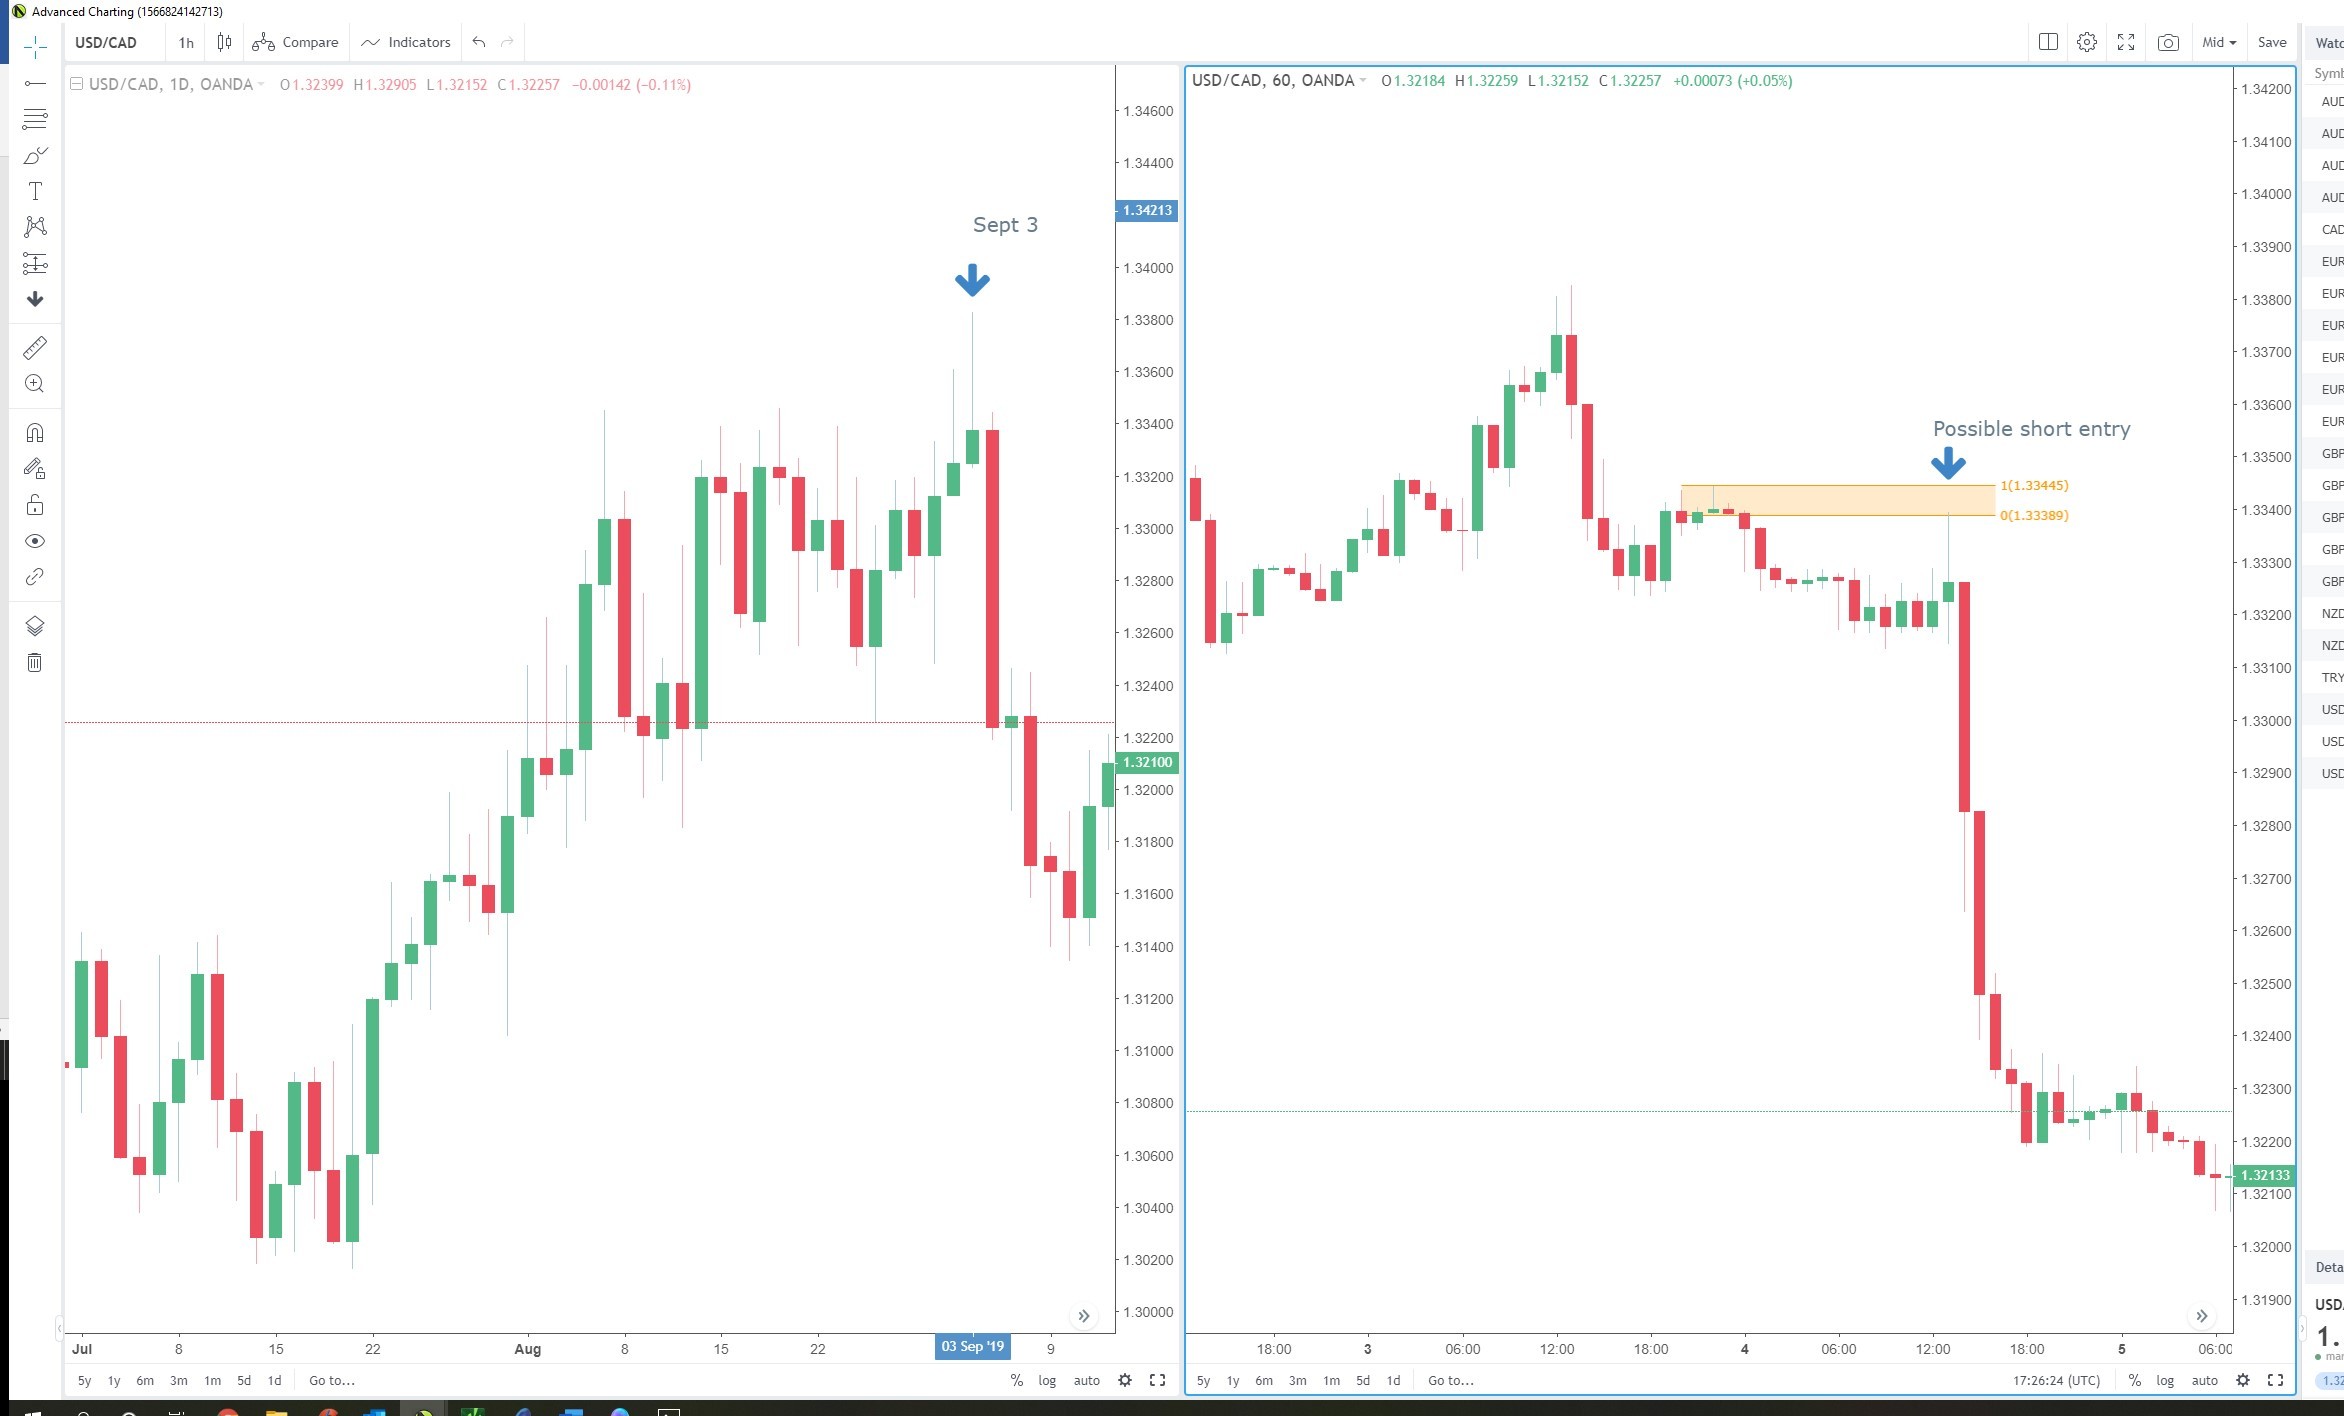
Notice we already had a move up from about 1.3020 to 1.3380 over a period of six weeks or so. The upward trend seems to be getting tired, the Sept 2 and 3 closing prices are indicating a bearish bias. On Sept 4, price traded below the Sept 3 low, indicating the bears are finally taking over. The plan would be to then go short in a smaller time frame supply zone.
The breakdown is, look for a bearish close after a move up into supply, drill down to a smaller time frame to find a supply zone for a short entry. Look for a bullish close after a move down into demand, drill down to a smaller time frame to find a demand zone for a long entry.
This content is intended to provide educational information only. This information should not be construed as individual or customized legal, tax, financial or investment services. As each individual's situation is unique, a qualified professional should be consulted before making legal, tax, financial and investment decisions. The educational information provided in this article does not comprise any course or a part of any course that may be used as an educational credit for any certification purpose and will not prepare any User to be accredited for any licenses in any industry and will not prepare any User to get a job. Reproduced by permission from OTAcademy.com click here for Terms of Use: https://www.otacademy.com/about/terms
Editors’ Picks

EUR/USD: Next target comes at 1.0530
EUR/USD traded in an inconclusive fashion amid the equally vacillating development in the Greenback, returning to the sub-1.0500 region following reduced trading conditions in response to the US Presidents’ Day holiday.

GBP/USD keeps the bullish bias above 1.2600
GBP/USD kicks off the new trading week on a positive foot and manages to reclaim the 1.2600 barrier and beyond on the back of the Greenback's steady price action.

USD/JPY slides to near 151.50 as Japanese Yen strengthens on robust GDP growth
USD/JPY falls sharply to near 151.40 as Yen performs strongly across the board on upbeat Q4 Japan GDP data. Flash Q4 Japan’s GDP data showed that the economy expanded by 0.7%. A delay in Trump’s reciprocal tariff plan and poor Retail Sales data would keep the US Dollar on the backfoot.
Editors’ Picks

AUD/USD: Warming up or the RBA
AUD/USD added to the move higher and rose to new two-month peaks near 0.6370 on the back of the soft tone in the US Dollar and rising expectation ahead of the RBA’s interest rate decision.
EUR/USD: Next target comes at 1.0530
EUR/USD traded in an inconclusive fashion amid the equally vacillating development in the Greenback, returning to the sub-1.0500 region following reduced trading conditions in response to the US Presidents’ Day holiday.

Gold resumes the upside around $2,900
Gold prices leave behind Friday's marked pullback and regain some composure, managing to retest the $2,900 region per ounce troy amid the generalised absence of volatility on US Presidents' Day holiday.

RBA expected to deliver first interest rate cut in over four years
The Reserve Bank of Australia will announce its first monetary policy decision of 2025 on Tuesday, and market participants anticipate the Board will cut the benchmark interest rate by 25 basis points.

Bitcoin Price Forecast: BTC stalemate soon coming to an end
Bitcoin price has been consolidating between $94,000 and $100,000 for almost two weeks. Amid this consolidation, investor sentiment remains indecisive, with US spot ETFs recording a $580.2 million net outflow last week, signaling institutional demand weakness.
RECOMMENDED LESSONS
Making money in forex is easy if you know how the bankers trade!
Discover how to make money in forex is easy if you know how the bankers trade!
5 Forex News Events You Need To Know
In the fast moving world of currency markets, it is extremely important for new traders to know the list of important forex news...
Top 10 Chart Patterns Every Trader Should Know
Chart patterns are one of the most effective trading tools for a trader. They are pure price-action, and form on the basis of underlying buying and...
7 Ways to Avoid Forex Scams
The forex industry is recently seeing more and more scams. Here are 7 ways to avoid losing your money in such scams: Forex scams are becoming frequent. Michael Greenberg reports on luxurious expenses, including a submarine bought from the money taken from forex traders. Here’s another report of a forex fraud. So, how can we avoid falling in such forex scams?
What Are the 10 Fatal Mistakes Traders Make
Trading is exciting. Trading is hard. Trading is extremely hard. Some say that it takes more than 10,000 hours to master. Others believe that trading is the way to quick riches. They might be both wrong. What is important to know that no matter how experienced you are, mistakes will be part of the trading process.

The Best Brokers of the Year
SPONSORED Explore top-quality choices worldwide and locally. Compare key features like spreads, leverage, and platforms. Find the right broker for your needs, whether trading CFDs, Forex pairs like EUR/USD, or commodities like Gold.