![]() Rick Wright
Rick Wright
Online Trading Academy
Hello traders! In last week's Lessons From the Pros newsletter, we discussed how learning to trade is like learning to drive a car - Learning to Trade is Like Learning to Drive. This week we will continue the driving theme while we look at charts to help us determine high probability/low risk trades.
When you pull up to an intersection, very often we have a couple of choices to make be it to turn left, right, or go straight. In trading, our choices are buy, sell or wait. In the following EURUSD chart, we have an intersection of a previous demand/supply zone and a pair of trendlines. When we come to this intersection, what is the higher probability trade, long or short?
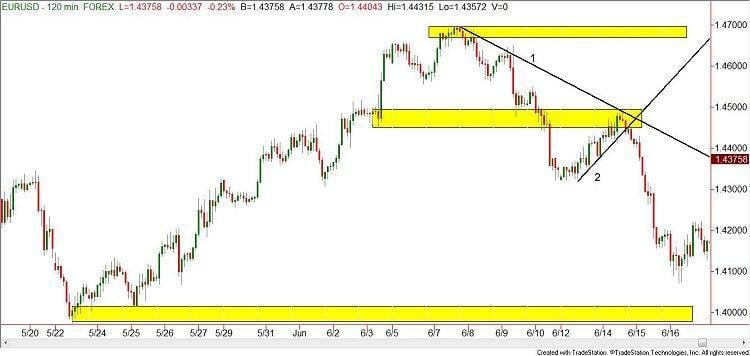
While we are in this yellow shaded supply and demand zone near the intersection of the two trendlines, we have a choice to make. Go left or right? Long or short? Or should we wait? When I teach one of our Online Trading Academy classes, this question comes up every trading day. If your answer to the buy sell or wait question is "wait," you have to ask yourself the next question. "Wait for what?" In this example, we are waiting to see which trendline is going to win at this intersection/decision point in our trading road. The general rule of thumb is that the trendline that has been valid the longest is the trendline that will win. Looking to the left on our supply demand zone area, there isn't a very compelling or high quality level we would have drawn here. Using the two trendlines and the intersection of all three can give us a trade. In this case, selling in the minor supply zone because of the longer term downward sloping trendline (#1) would have been the proper trade.
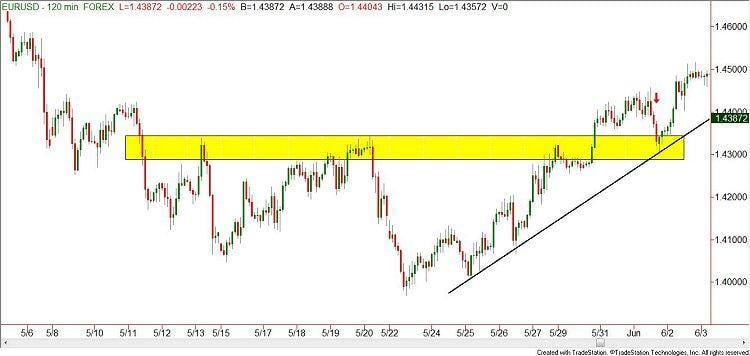
In the following EURUSD chart, we only have an intersection of a trendline and a supply demand zone. As the price action falls quickly into the yellow demand zone near the red arrow, there isn't really a clear downward trendline that we can draw into that zone.
However, the longer term upward sloping trendline is very obvious. Coming into this intersection, we only have two choices, buy or wait. (You could make the case for planning a short trade, but not until the yellow demand zone had been broken or even broken and then re-tested.) Why on earth would you sell IN the yellow demand zone? No reason at this intersection. If price drops through the demand zone, there would be a potential sell. But at this time, the better choice is to hit the buy button. If your answer to the question buy, sell or wait was to wait, what on earth are you waiting for? A traffic cop to point at you and tell you to go? I hope you don't need that!
Let's explore this topic a bit more. Leaving our driving analogies for a moment, what kind of trades are these - reversal or trend – following? Most people will answer trend - following. Guess what? Every trade is BOTH. On these two charts they are obvious trend followers, but when you zoom in on a smaller time frame –for example a 10 minute chart-you will notice very often a reversal trade.
What are we looking for in a reversal trade? Usually, some type of reversal pattern like a double top/bottom, head and shoulders, etc. The plan of action is then to do the following: In a larger time frame chart, look for an intersection of a trendline (or two!) and a supply demand zone. Look for a smaller time frame reversal pattern in the intersection. This should give you the direction to trade with a higher probability of being right.
Practice this technique like you practiced driving, and make sure you look both ways before turning!
This content is intended to provide educational information only. This information should not be construed as individual or customized legal, tax, financial or investment services. As each individual's situation is unique, a qualified professional should be consulted before making legal, tax, financial and investment decisions. The educational information provided in this article does not comprise any course or a part of any course that may be used as an educational credit for any certification purpose and will not prepare any User to be accredited for any licenses in any industry and will not prepare any User to get a job. Reproduced by permission from OTAcademy.com click here for Terms of Use: https://www.otacademy.com/about/terms
Editors’ Picks

EUR/USD: Next target comes at 1.0530
EUR/USD traded in an inconclusive fashion amid the equally vacillating development in the Greenback, returning to the sub-1.0500 region following reduced trading conditions in response to the US Presidents’ Day holiday.

GBP/USD keeps the bullish bias above 1.2600
GBP/USD kicks off the new trading week on a positive foot and manages to reclaim the 1.2600 barrier and beyond on the back of the Greenback's steady price action.

USD/JPY slides to near 151.50 as Japanese Yen strengthens on robust GDP growth
USD/JPY falls sharply to near 151.40 as Yen performs strongly across the board on upbeat Q4 Japan GDP data. Flash Q4 Japan’s GDP data showed that the economy expanded by 0.7%. A delay in Trump’s reciprocal tariff plan and poor Retail Sales data would keep the US Dollar on the backfoot.
Editors’ Picks

AUD/USD: Warming up or the RBA
AUD/USD added to the move higher and rose to new two-month peaks near 0.6370 on the back of the soft tone in the US Dollar and rising expectation ahead of the RBA’s interest rate decision.
EUR/USD: Next target comes at 1.0530
EUR/USD traded in an inconclusive fashion amid the equally vacillating development in the Greenback, returning to the sub-1.0500 region following reduced trading conditions in response to the US Presidents’ Day holiday.

Gold resumes the upside around $2,900
Gold prices leave behind Friday's marked pullback and regain some composure, managing to retest the $2,900 region per ounce troy amid the generalised absence of volatility on US Presidents' Day holiday.

RBA expected to deliver first interest rate cut in over four years
The Reserve Bank of Australia will announce its first monetary policy decision of 2025 on Tuesday, and market participants anticipate the Board will cut the benchmark interest rate by 25 basis points.

Bitcoin Price Forecast: BTC stalemate soon coming to an end
Bitcoin price has been consolidating between $94,000 and $100,000 for almost two weeks. Amid this consolidation, investor sentiment remains indecisive, with US spot ETFs recording a $580.2 million net outflow last week, signaling institutional demand weakness.
RECOMMENDED LESSONS
Making money in forex is easy if you know how the bankers trade!
Discover how to make money in forex is easy if you know how the bankers trade!
5 Forex News Events You Need To Know
In the fast moving world of currency markets, it is extremely important for new traders to know the list of important forex news...
Top 10 Chart Patterns Every Trader Should Know
Chart patterns are one of the most effective trading tools for a trader. They are pure price-action, and form on the basis of underlying buying and...
7 Ways to Avoid Forex Scams
The forex industry is recently seeing more and more scams. Here are 7 ways to avoid losing your money in such scams: Forex scams are becoming frequent. Michael Greenberg reports on luxurious expenses, including a submarine bought from the money taken from forex traders. Here’s another report of a forex fraud. So, how can we avoid falling in such forex scams?
What Are the 10 Fatal Mistakes Traders Make
Trading is exciting. Trading is hard. Trading is extremely hard. Some say that it takes more than 10,000 hours to master. Others believe that trading is the way to quick riches. They might be both wrong. What is important to know that no matter how experienced you are, mistakes will be part of the trading process.

The Best Brokers of the Year
SPONSORED Explore top-quality choices worldwide and locally. Compare key features like spreads, leverage, and platforms. Find the right broker for your needs, whether trading CFDs, Forex pairs like EUR/USD, or commodities like Gold.