![]() Anna Radomska
Anna Radomska
Sunshine Profits
We could summarize the recent price action in crude oil in one word: tests. What’s next?
Technical picture of Crude Oil
Crude oil closed last week above the previously broken Dec. 2023 peak and the barrier of $80. Did it change much in the medium- and short-term picture of the commodity? In today's article, I share with you my thoughts on this subject. Have a nice read.
Let’s start with quotes from Friday’s Oil Trading Alert:
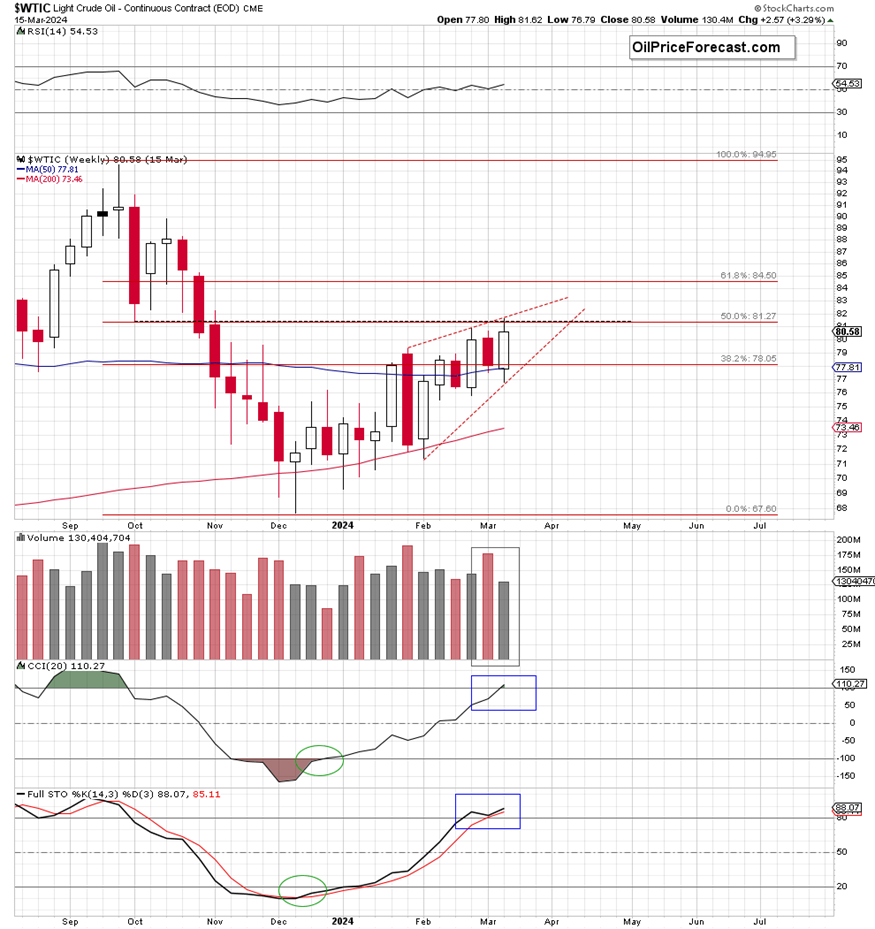
(…) yesterday’s upswing took crude oil to the strong resistance area created by the upper border of the red triangle, the 50% Fibonacci retracement based on the entire Oct.-Dec. 2023 decline and the yellow resistance zone based on the early and mid-Oct.2023 lows (marked with the black resistance line on the weekly chart).
Additionally, the increase materialized on even smaller volume than the white candle from Wednesday, which raises some doubts about the strength of the bulls – especially when we factor in the weekly volume (yup, the week is not over yet, but the volume so far is quite disappointing when we consider the above-mentioned breakouts).
On the weekly chart, we also see that the indicators moved to their overbought areas (for the first time since Oct.2023), which suggests that the space for gains may be limited and reversal is just around the corner.
From today’s point of view, we see that the situation developed in tune with the above scenario and crude oil moved a bit lower during Friday’s session.
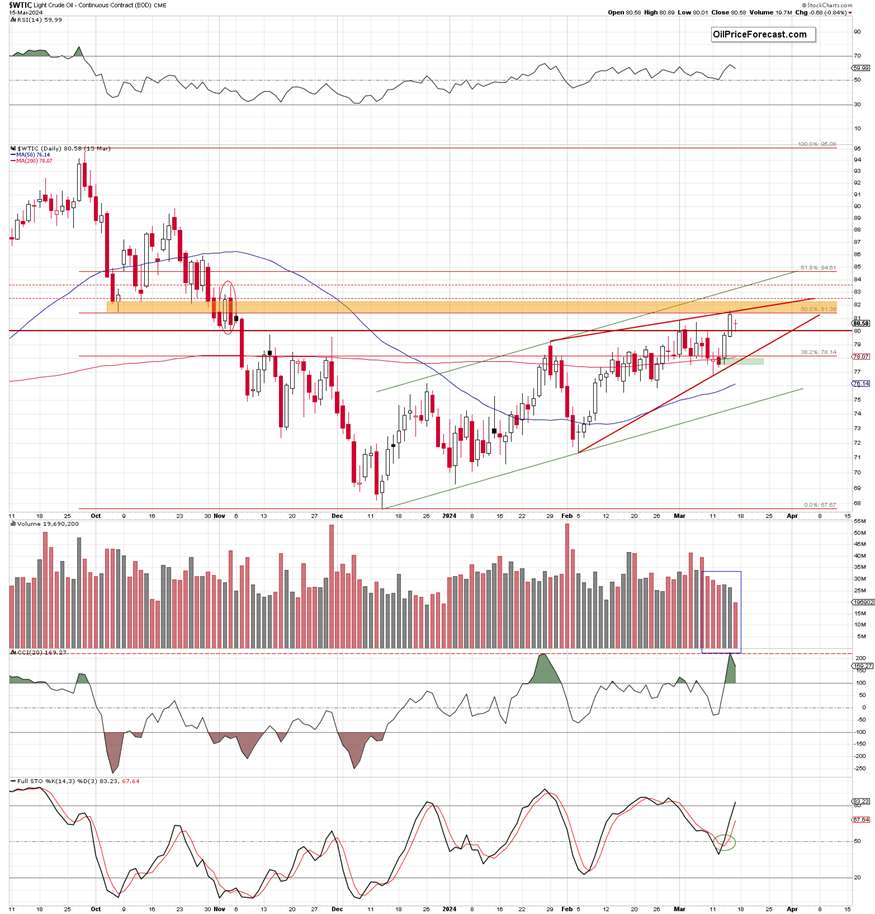
As you see, the commodity started the day below Thursday’s closing price, creating a gap ($80.58-$81.26) that now serves as the nearest resistance. This deterioration encouraged the sellers to test the previously broken barrier of $80, but the support withstood the selling pressure, which resulted in a comeback to the opening price.
Thanks to this price action, market participants created a doji candlestick on the chart, which suggests some indecisions – especially when we factor in the smallest volume in March (which indicates that the involvement in shaping subsequent candles decreases from session to session).
A pro-declining gap
And speaking of the volume… last week’s candlestick materialized on a smaller volume than the previous declining red candle, which doesn’t confirm oil bulls’ strength, suggesting that another attempt to move lower may be just around the corner.
Taking all the above into account, and combining it with the current situation in the 4-hour chart, I believe that the recent commentary on black gold is up to date also today:
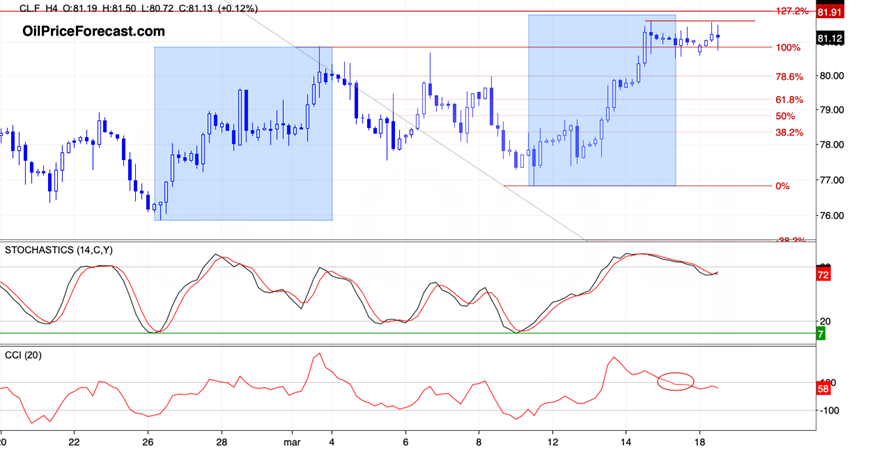
(…) crude oil futures reversed and moved lower earlier today, signaling that further deterioration is very likely (…)
As you see on the above chart, recent very short-term rally is very similar to the size of the upward move that we could observe just before the Mar. 1st peak was formed.
Therefore, it seems that even if the bulls decide to attack once again, the space for increase could be limited (at $81.81 the current upward move would be equal to the previous move) – not only from the ABCD formation point of view, but also from the Fibonacci extension perspective (at $81.91 [marked with the red horizontal line] there is 127.2% Fibonacci extension based on the recent Mar. declines).
Summing up, crude oil closed another day above the previous peak and the barrier of $80, but despite this positive development, Friday’s session started with the pro-declining gap, which continues to serve as the nearest resistance. Additionally, the technical picture (the nearest resistance zone, the similarity of the upward moves, the current position of the daily and weekly indicators, and the disappointing volume (not only daily, but also weekly) suggests that the space for further increases seems limited and a reversal is just around the corner.
Want free follow-ups to the above article and details not available to 99%+ investors? Sign up to our free newsletter today!
All essays, research and information found above represent analyses and opinions of Przemyslaw Radomski, CFA and Sunshine Profits' employees and associates only. As such, it may prove wrong and be a subject to change without notice. Opinions and analyses were based on data available to authors of respective essays at the time of writing. Although the information provided above is based on careful research and sources that are believed to be accurate, Przemyslaw Radomski, CFA and his associates do not guarantee the accuracy or thoroughness of the data or information reported. The opinions published above are neither an offer nor a recommendation to purchase or sell any securities. Mr. Radomski is not a Registered Securities Advisor. By reading Przemyslaw Radomski's, CFA reports you fully agree that he will not be held responsible or liable for any decisions you make regarding any information provided in these reports. Investing, trading and speculation in any financial markets may involve high risk of loss. Przemyslaw Radomski, CFA, Sunshine Profits' employees and affiliates as well as members of their families may have a short or long position in any securities, including those mentioned in any of the reports or essays, and may make additional purchases and/or sales of those securities without notice.
Recommended Content
Editors’ Picks
AUD/USD: Warming up or the RBA
AUD/USD added to the move higher and rose to new two-month peaks near 0.6370 on the back of the soft tone in the US Dollar and rising expectation ahead of the RBA’s interest rate decision.

EUR/USD: Next target comes at 1.0530
EUR/USD traded in an inconclusive fashion amid the equally vacillating development in the Greenback, returning to the sub-1.0500 region following reduced trading conditions in response to the US Presidents’ Day holiday.

Gold resumes the upside around $2,900
Gold prices leave behind Friday's marked pullback and regain some composure, managing to retest the $2,900 region per ounce troy amid the generalised absence of volatility on US Presidents' Day holiday.

RBA expected to deliver first interest rate cut in over four years
The Reserve Bank of Australia will announce its first monetary policy decision of 2025 on Tuesday, and market participants anticipate the Board will cut the benchmark interest rate by 25 basis points.

Bitcoin Price Forecast: BTC stalemate soon coming to an end
Bitcoin price has been consolidating between $94,000 and $100,000 for almost two weeks. Amid this consolidation, investor sentiment remains indecisive, with US spot ETFs recording a $580.2 million net outflow last week, signaling institutional demand weakness.

The Best Brokers of the Year
SPONSORED Explore top-quality choices worldwide and locally. Compare key features like spreads, leverage, and platforms. Find the right broker for your needs, whether trading CFDs, Forex pairs like EUR/USD, or commodities like Gold.