![]() Elliott Wave Forecast Team
Elliott Wave Forecast Team
ElliottWave-Forecast.com
AT&T Inc. (T) is an American multinational telecommunications holding company headquartered in Dallas, Texas. It is the world’s largest telecommunications company by revenue and the third-largest provider of mobile telephone services in the U.S.
AT&T (T) monthly chart September 2024
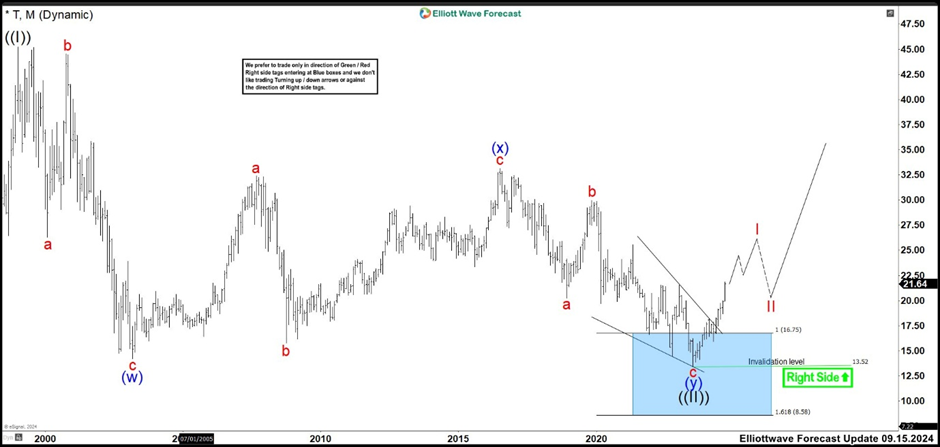
In the last monthly chart, we saw the rally that left from the blue box. The rally does not mean that T cannot resume to the downside again. To confirm that wave ((II)) is over at $13.43 low, the market needs to break above of wave ((I)) high. Until then, T could make perfectly any other structure that leads us to lower prices. At the moment, the stock is doing very well suggesting the trend is developing an impulse structure. (If you want to learn more about Elliott Wave Theory, follow these links: Elliott Wave Education and Elliott Wave Theory).
AT&T (T) weekly chart September 2024
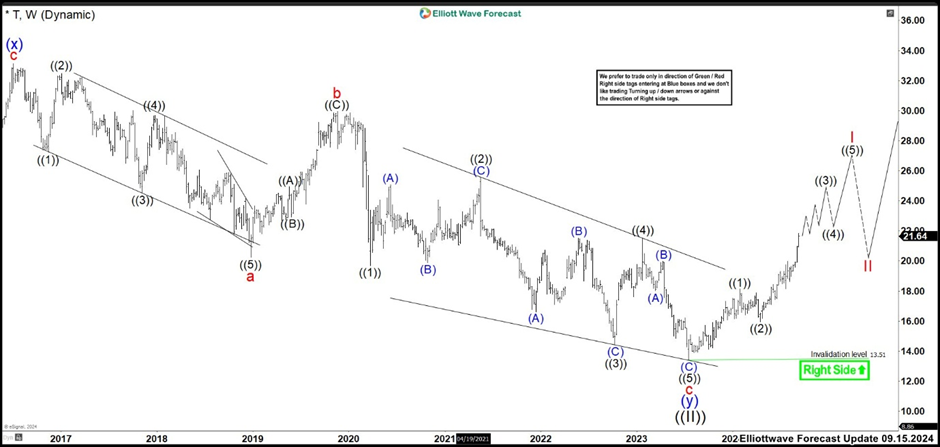
Also in September, the weekly chart above showed how the wave ((5)) of c of the ending diagonal completed the structure. Wave ((II)) ended at $13.43 low and rallied looking to build an impulse higher as wave I. The first leg higher as wave ((1)) ended at $18.16 high. Wave ((2)) pullback finished at $15.94 low and resumed higher again. AT&T pushed strongly to the upside breaking the pivots of the RSI in the weekly timeframe, suggesting that the cycle from 2019 high was over. Then, we expected to build an impulse structure as the chart before seeing 3, 7 or 11 swings correction as wave II.
AT&T (T) weekly chart February 2025
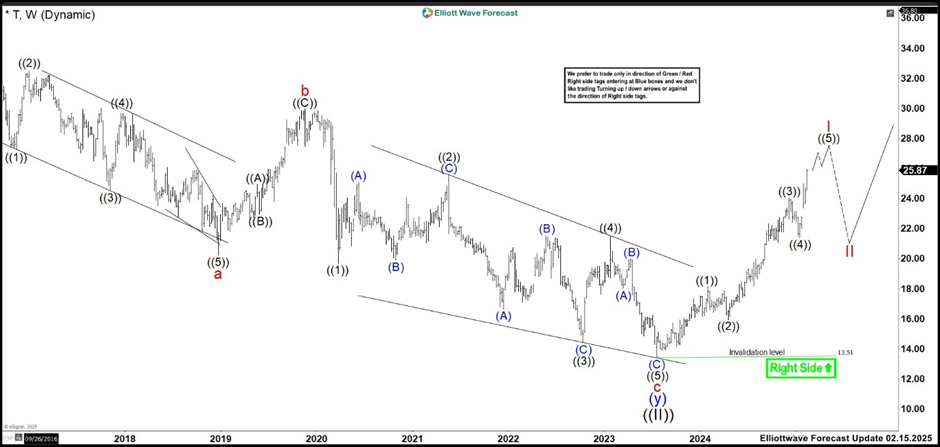
After 5 months, the stock is showing a clear structure of 5 swings given the idea of the impulse structure is very possible. Wave ((3)) completed at 24.03 high and the correction as wave ((4)) ended at 21.38 low. T continued to the upside and the last EPS results better than the expectations, triggered a strong uptrend movement. Currently, we are expecting an extension structure as wave ((5)) and the market is doing wave (3) of ((5)). Once wave (3) is completed, we must see a clear pullback to called wave (4) of ((5)). Then, we expect to do a last push higher to end wave (5) of ((5)) and also wave I before seeing wave II correction. We are projecting that wave I must end in 26.44 – 28.64 area. Let see what the market give us. Trade smart!
FURTHER DISCLOSURES AND DISCLAIMER CONCERNING RISK, RESPONSIBILITY AND LIABILITY Trading in the Foreign Exchange market is a challenging opportunity where above average returns are available for educated and experienced investors who are willing to take above average risk. However, before deciding to participate in Foreign Exchange (FX) trading, you should carefully consider your investment objectives, level of xperience and risk appetite. Do not invest or trade capital you cannot afford to lose. EME PROCESSING AND CONSULTING, LLC, THEIR REPRESENTATIVES, AND ANYONE WORKING FOR OR WITHIN WWW.ELLIOTTWAVE- FORECAST.COM is not responsible for any loss from any form of distributed advice, signal, analysis, or content. Again, we fully DISCLOSE to the Subscriber base that the Service as a whole, the individual Parties, Representatives, or owners shall not be liable to any and all Subscribers for any losses or damages as a result of any action taken by the Subscriber from any trade idea or signal posted on the website(s) distributed through any form of social-media, email, the website, and/or any other electronic, written, verbal, or future form of communication . All analysis, trading signals, trading recommendations, all charts, communicated interpretations of the wave counts, and all content from any media form produced by www.Elliottwave-forecast.com and/or the Representatives are solely the opinions and best efforts of the respective author(s). In general Forex instruments are highly leveraged, and traders can lose some or all of their initial margin funds. All content provided by www.Elliottwave-forecast.com is expressed in good faith and is intended to help Subscribers succeed in the marketplace, but it is never guaranteed. There is no “holy grail” to trading or forecasting the market and we are wrong sometimes like everyone else. Please understand and accept the risk involved when making any trading and/or investment decision. UNDERSTAND that all the content we provide is protected through copyright of EME PROCESSING AND CONSULTING, LLC. It is illegal to disseminate in any form of communication any part or all of our proprietary information without specific authorization. UNDERSTAND that you also agree to not allow persons that are not PAID SUBSCRIBERS to view any of the content not released publicly. IF YOU ARE FOUND TO BE IN VIOLATION OF THESE RESTRICTIONS you or your firm (as the Subscriber) will be charged fully with no discount for one year subscription to our Premium Plus Plan at $1,799.88 for EACH person or firm who received any of our content illegally through the respected intermediary’s (Subscriber in violation of terms) channel(s) of communication.
Recommended content
Editors’ Picks

AUD/USD: Warming up or the RBA
AUD/USD added to the move higher and rose to new two-month peaks near 0.6370 on the back of the soft tone in the US Dollar and rising expectation ahead of the RBA’s interest rate decision.

EUR/USD: Next target comes at 1.0530
EUR/USD traded in an inconclusive fashion amid the equally vacillating development in the Greenback, returning to the sub-1.0500 region following reduced trading conditions in response to the US Presidents’ Day holiday.

Gold resumes the upside around $2,900
Gold prices leave behind Friday's marked pullback and regain some composure, managing to retest the $2,900 region per ounce troy amid the generalised absence of volatility on US Presidents' Day holiday.

Ethereum Price Forecast: ETH outperforms top cryptocurrencies, sees $1.1 billion in stablecoin inflows
Ethereum (ETH) is up 1% on Monday, stretching its weekly gains to nearly 3%, while other top blockchains experience losses. The top altcoin's recent outperformance can be attributed to rising stablecoin inflows and investment from institutional investors through ETH exchange-traded funds (ETFs).

Bitcoin Price Forecast: BTC stalemate soon coming to an end
Bitcoin price has been consolidating between $94,000 and $100,000 for almost two weeks. Amid this consolidation, investor sentiment remains indecisive, with US spot ETFs recording a $580.2 million net outflow last week, signaling institutional demand weakness.

The Best Brokers of the Year
SPONSORED Explore top-quality choices worldwide and locally. Compare key features like spreads, leverage, and platforms. Find the right broker for your needs, whether trading CFDs, Forex pairs like EUR/USD, or commodities like Gold.